Free printable practice
Data Graphing Practice Activities
Printable Class 2 data graphing worksheets for collecting, sorting, tallying, and reading information in pictographs, bar graphs, line plots, pie charts, and Venn diagrams.
Explore Data Graphing
Practice that builds confidence
Building data sense step by step
Class 2 children practise turning simple information into organised data. These worksheets build confidence with sorting, counting, tally marks, pictographs, bar graphs, bar charts, line plots, line graphs, pie charts, and Venn diagrams.
The printable activities include real-life themes such as favourite fruits, toys, colours, pets, classroom choices, and simple number data. Children read graphs, answer questions, compare groups, complete missing parts, and make their own charts from collected data.
Data graphing in Class 2 begins with noticing categories: red blocks, blue blocks, apples, bananas, buses, cars. Children then sort items, count each group, and record totals in a tally sheet. From there, they move to pictographs, bar graphs, bar charts, line plots, simple line graphs, pie charts, and Venn diagrams. This progression helps children see that the same data can be shown in different ways.

What children learn to read
The worksheets give practice with titles, labels, categories, keys, tally marks, and values. In a pictograph, children check what one picture stands for. In a bar graph, they compare bar heights. In a line plot, they count marks above a number. In a Venn diagram, they look for items that belong to one group, the other group, or both. Pie chart tasks are kept simple, focusing on reading parts of a whole rather than advanced fractions.
A simple parent routine
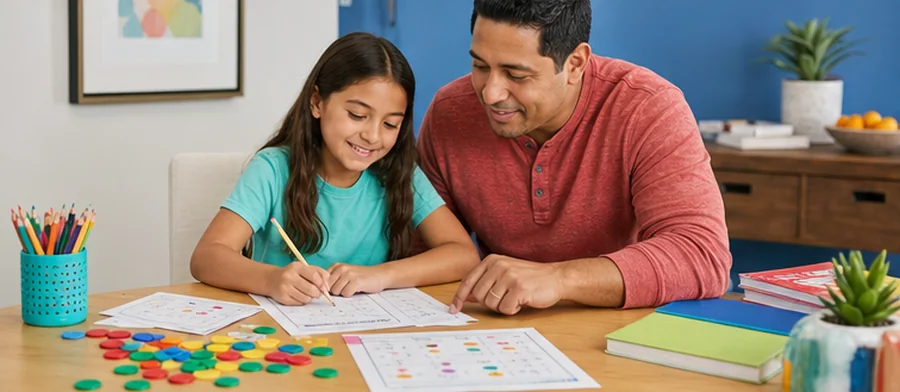
At home, collect quick data from daily life. Ask, “Which fruit did our family eat today?” or “How many red, blue, and green crayons are in the box?” Let your child sort the items, make tally marks, count the totals, and draw a small graph. Finish with three questions: Which is most? Which is least? How many more? This routine connects maths to objects children can see and touch.
Classroom uses for teachers
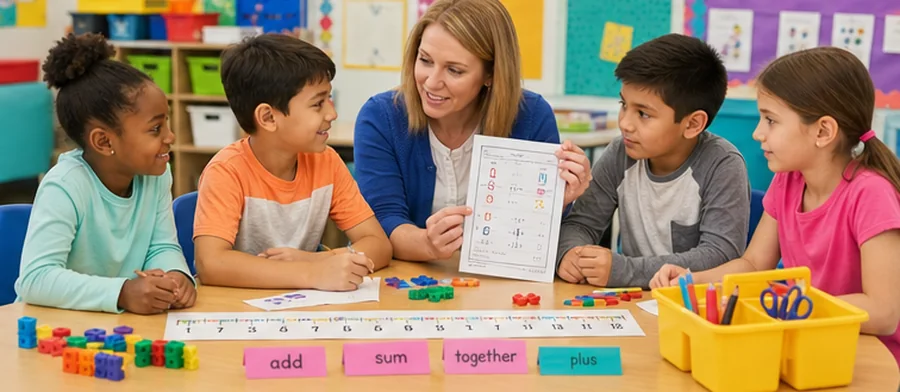
Teachers can use these pages for maths centres, whole-class graph discussions, morning data questions, or small-group support. One group can collect data, another can make a tally sheet, and another can turn the same information into a pictograph or bar chart. Venn diagram pages work well for comparing shapes, animals, foods, or classroom objects.
Common errors to watch for
Children may skip-count tally marks incorrectly, forget to use the graph key, compare bars without checking the scale, or place an item in the wrong part of a Venn diagram. They may also answer from memory instead of reading the graph. Encourage them to point to the label, count carefully, and show where the answer comes from.
Free printable PDF download
Use this class 2 data graphing worksheet page to preview the activity, print it, or download it as a PDF for quick practice. It works well for homework, homeschool lessons, tutoring, morning work, revision, and classroom centers.
Answers and answer key support
After the child completes the worksheet independently, parents and teachers can use the answer support or answer key information to check the work, review mistakes, and choose the next practice step.
Why iBloom worksheets help
iBloom worksheets use clear layouts, familiar examples, and gradual tasks so children focus on the data skill rather than confusing page design. A child-friendly strategy is: “Read the title, check the labels, count or compare, then answer.” Repeating this routine across tally sheets, pictographs, bar graphs, pie charts, line graphs, and Venn diagrams builds steady confidence.
Helpful answers
Frequently asked questions
What data graphing skills are covered for Class 2?
The worksheets cover sorting and counting data, using tally sheets, reading pictographs, bar graphs, bar charts, line plots, simple line graphs, pie charts, and Venn diagrams.
Are pie charts suitable for Class 2 children?
Yes, when they are simple. These activities focus on reading clearly divided parts and answering basic questions, not on advanced fraction or percentage calculations.
How can I help my child understand tally marks?
Ask your child to count real objects and draw one tally mark for each item. Practise grouping the fifth mark across the first four so they see tallies as quick groups of five.
What is the difference between a pictograph and a bar graph?
A pictograph uses pictures or symbols to show data, often with a key. A bar graph uses bars of different lengths or heights to compare categories.
How can teachers use these data worksheets in class?
Teachers can use them for maths centres, group data collection, graph-making practice, quick checks after a lesson, or discussion tasks where children explain how they found an answer.
Is this class 2 data graphing worksheet free?
Yes. You can preview it for free and use the printable worksheet for home or classroom practice.
Can I download this class 2 data graphing worksheet as a PDF?
Yes. Use the worksheet download option to save a printable PDF, or print the worksheet directly from the page.
Does this class 2 data graphing worksheet include answers or an answer key?
When the activity has fixed answers, iBloom includes answer support so parents and teachers can check the completed worksheet.