Free printable practice
Data Graphing Practice Activities
Class 3 maths worksheets for collecting, labelling, drawing, and interpreting tally charts, pictographs, bar graphs, line plots, line graphs, circle graphs, and Venn diagrams.
Explore Data Graphing
Free printable worksheet PDFs
Preview every available page, then download the free worksheet PDF for home, homeschool, tutoring, or classroom practice.
Preview the exact activity before downloading it.
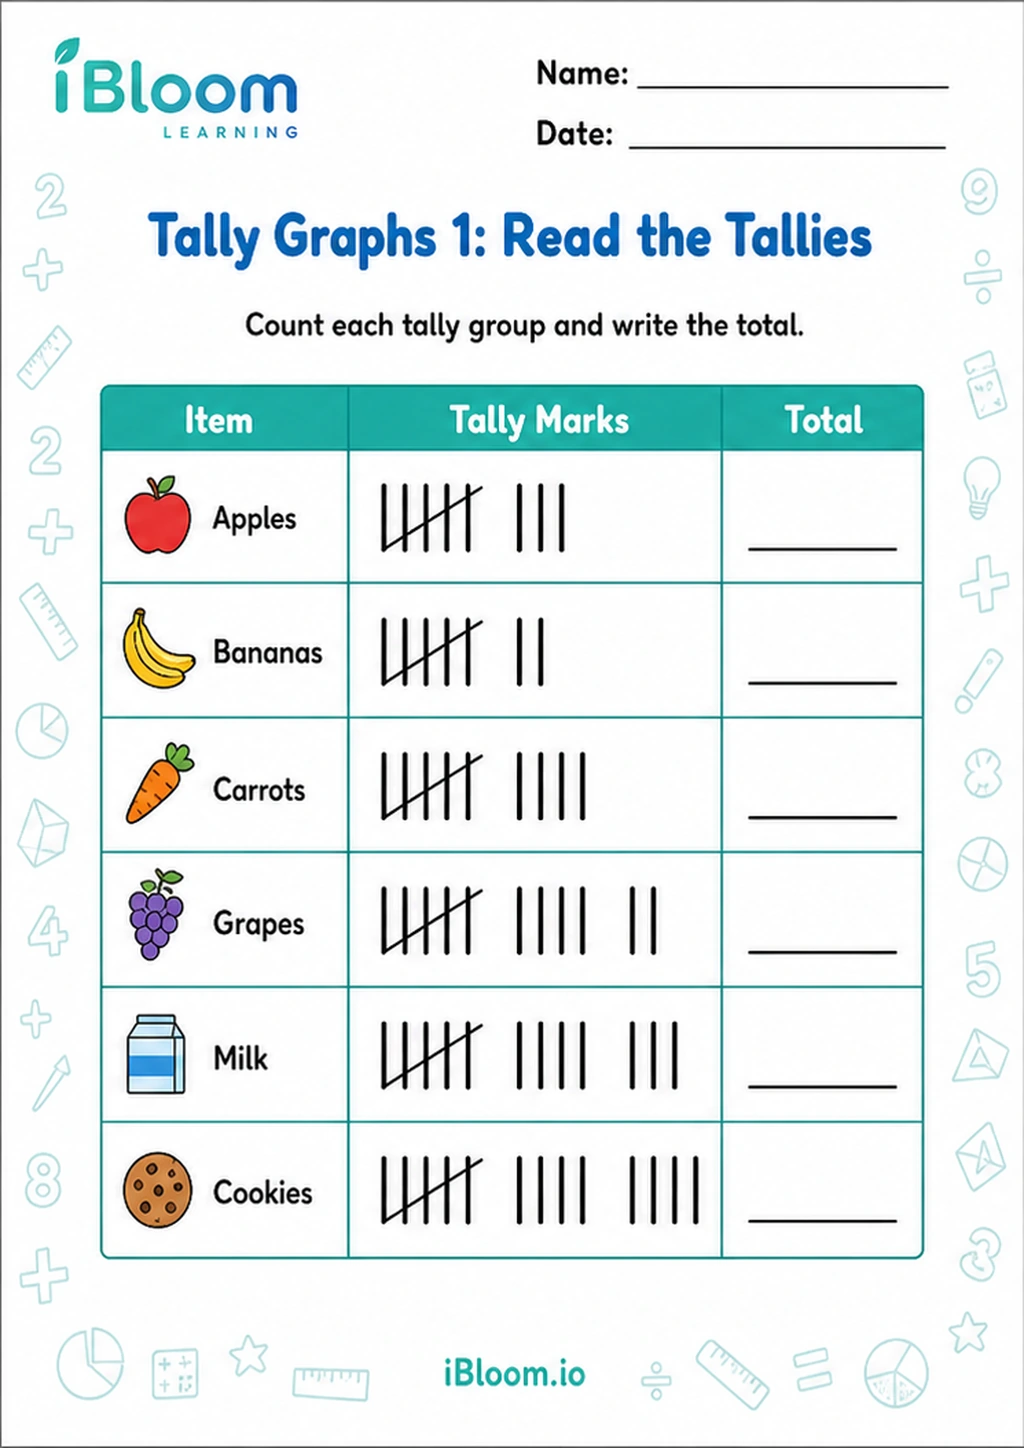 Tally Graphs 1: Read the TalliesClass 3 printable practice for Tally Charts and Graphs.Class 3Free PDF preview
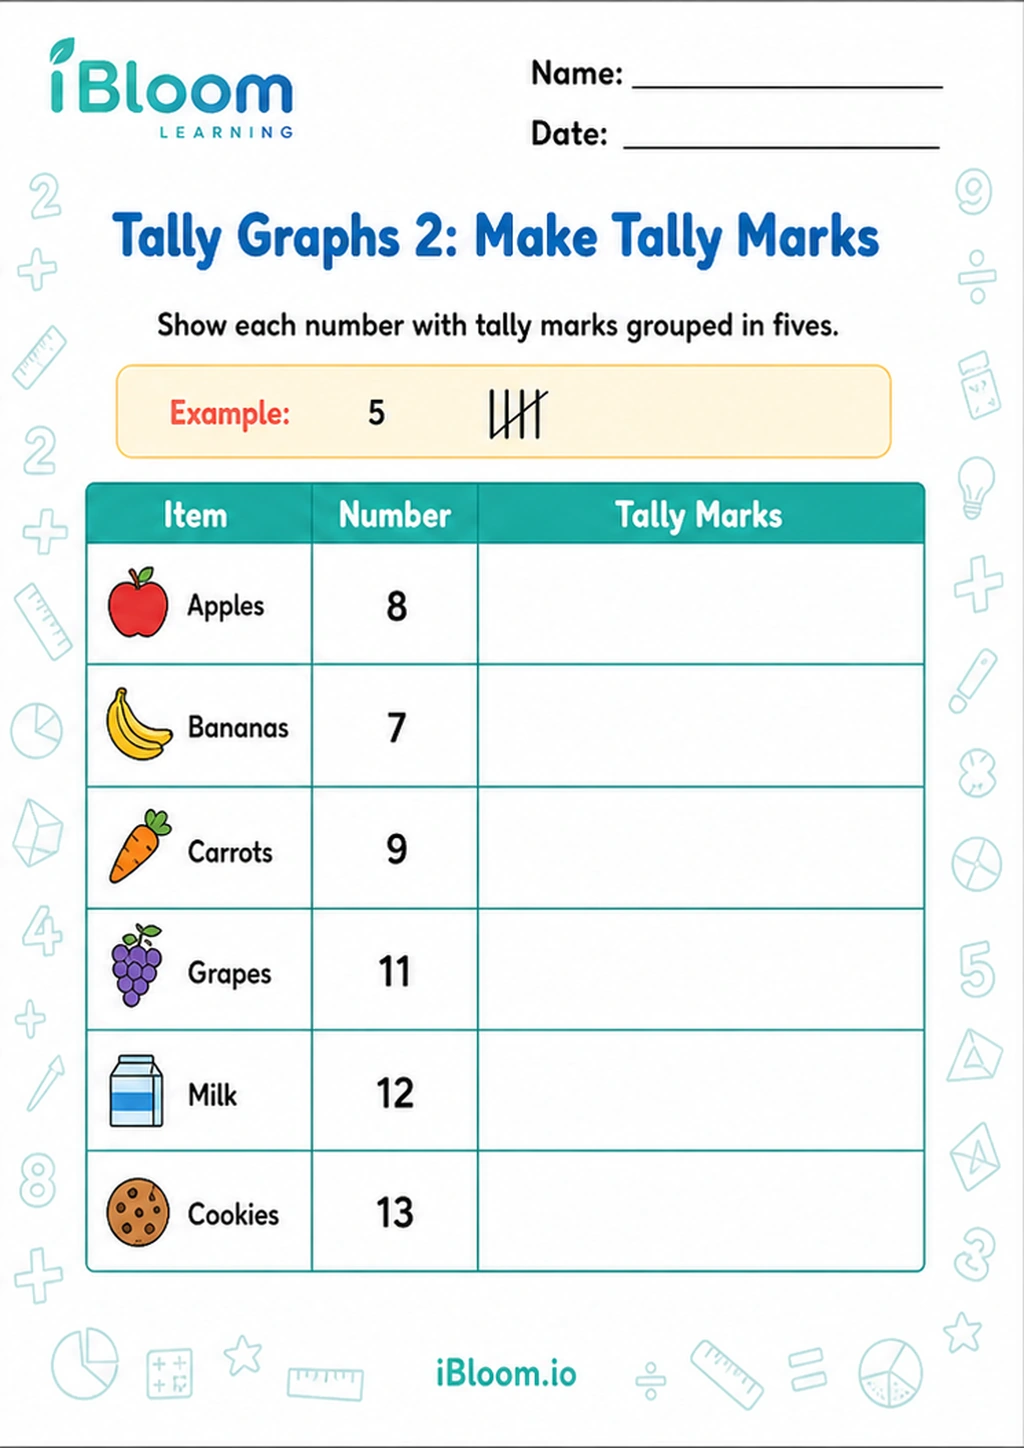 Tally Graphs 2: Make Tally MarksClass 3 printable practice for Tally Charts and Graphs.Class 3Free PDF preview
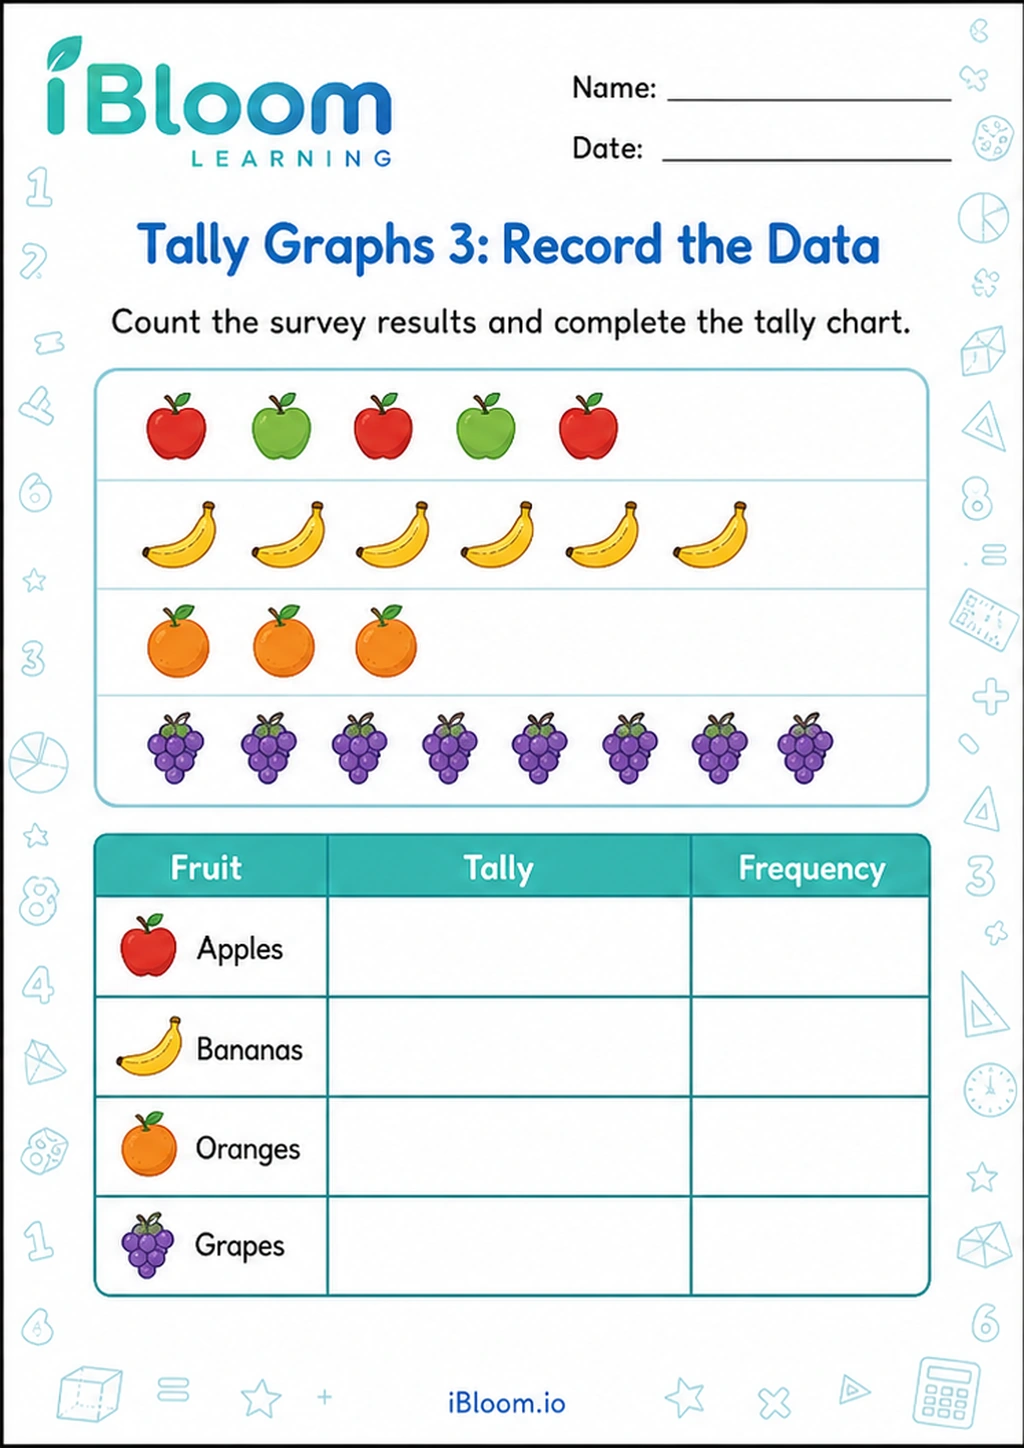 Tally Graphs 3: Record the DataClass 3 printable practice for Tally Charts and Graphs.Class 3Free PDF preview
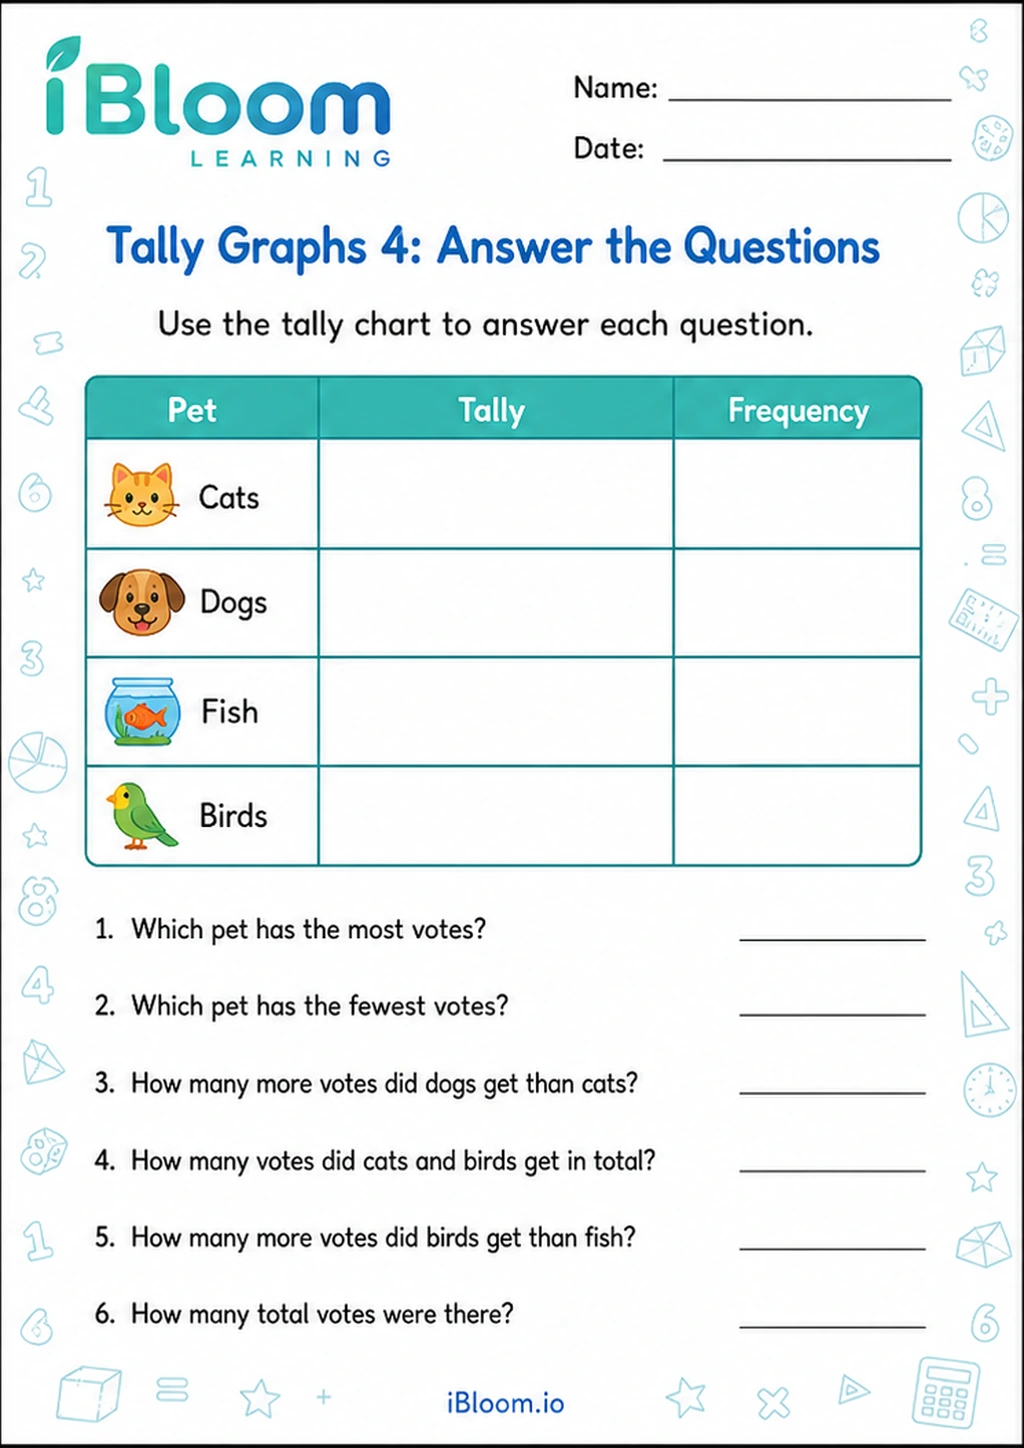 Tally Graphs 4: Answer the QuestionsClass 3 printable practice for Tally Charts and Graphs.Class 3Free PDF preview
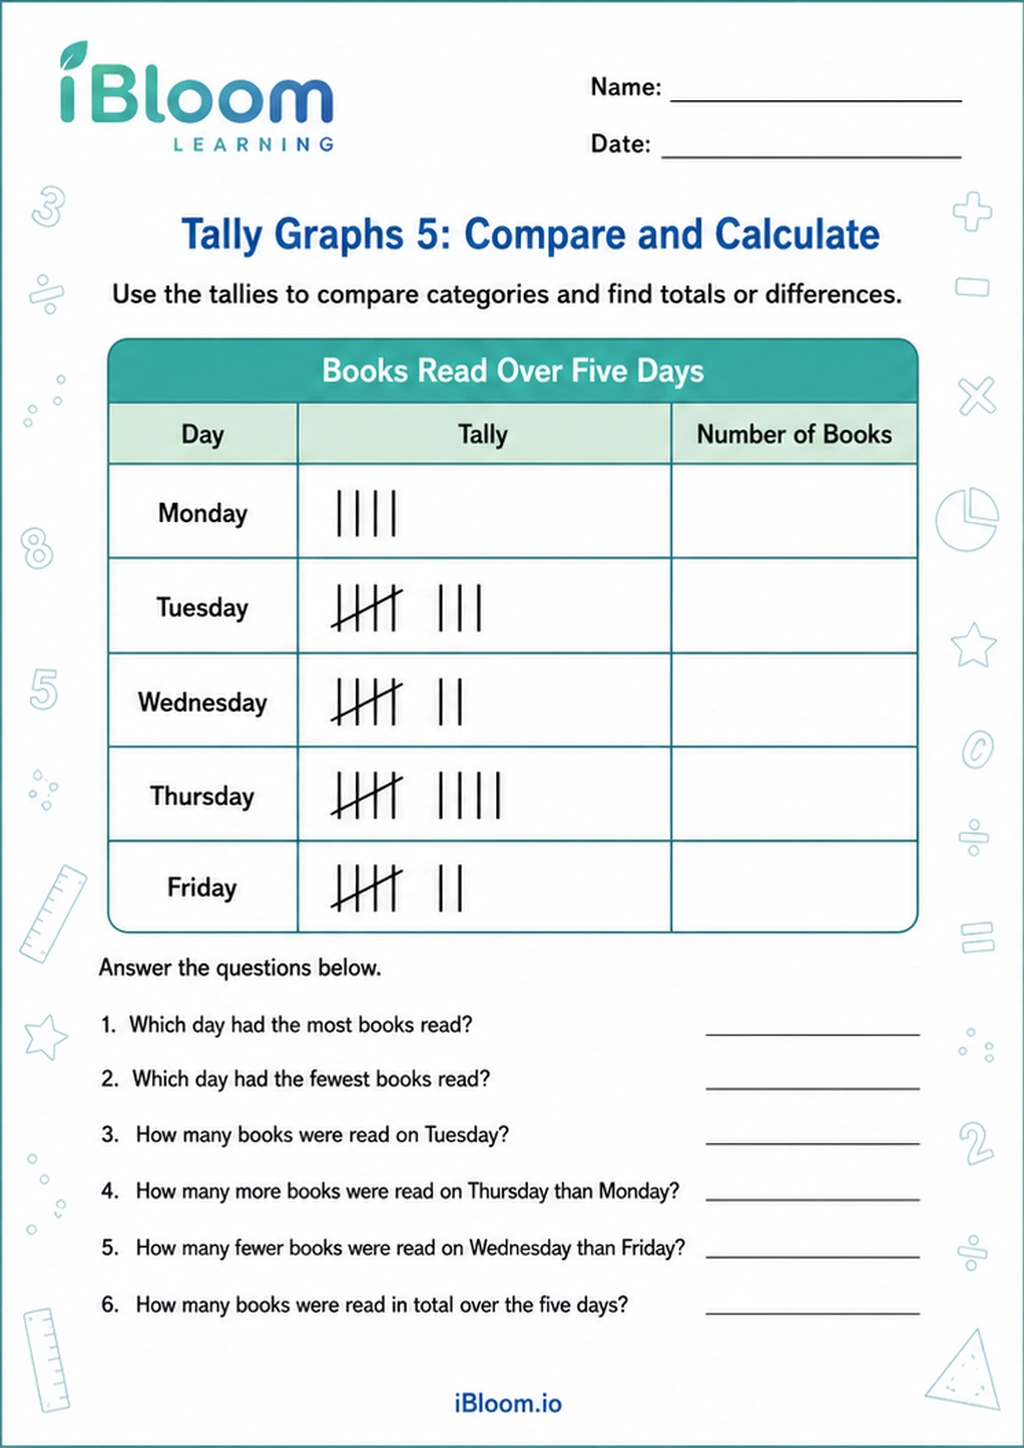 Tally Graphs 5: Compare and CalculateClass 3 printable practice for Tally Charts and Graphs.Class 3Free PDF preview
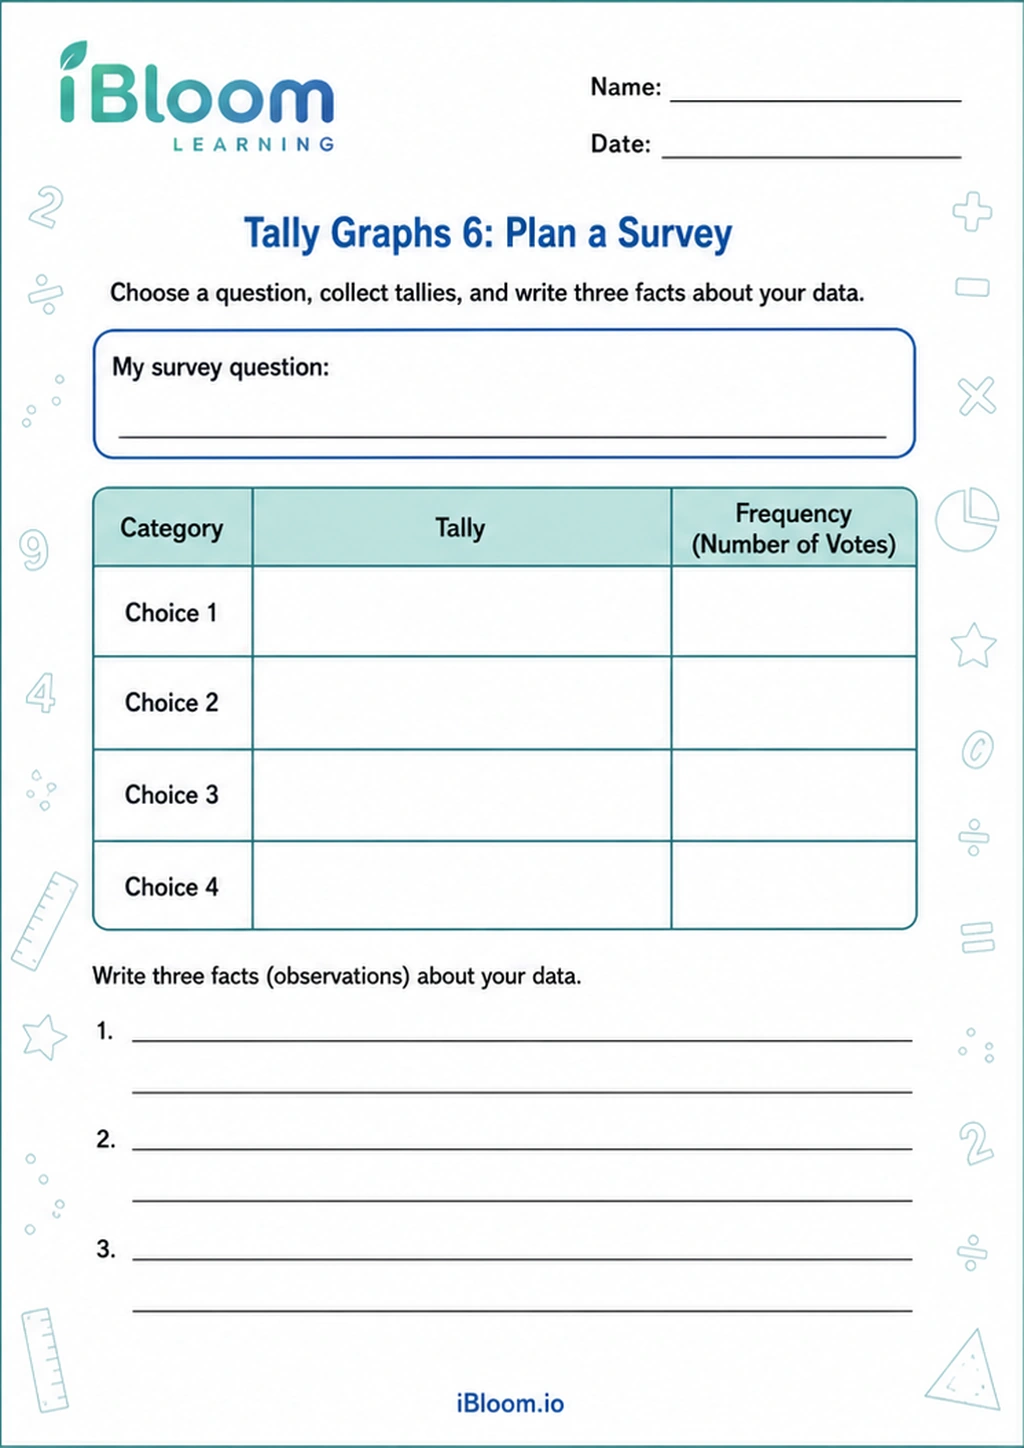 Tally Graphs 6: Plan a SurveyClass 3 printable practice for Tally Charts and Graphs.Class 3Free PDF preview
Practice that builds confidence
What children learn
These Class 3 data graphing worksheets help children collect, organise, show, and read information in clear visual ways. Learners practise tally graphs, scaled pictographs and scaled bar graphs, line plots, simple line graphs, circle graphs, and triple Venn diagrams while building the habit of checking titles, labels, keys, and scales.
Printable activities include drawing and labelling graphs from given data, answering comparison questions, analysing scaled bar graphs, sorting information into Venn diagrams, and recording data from small surveys. The tasks move from counting marks and pictures to interpreting more compact representations where one symbol or interval can stand for several items.
Children connect raw data to useful displays. A list of favourite fruits can become tally marks, a pictograph, or a scaled bar graph; a set of measurements can become a line plot; changing values can be shown on a simple line graph. They learn vocabulary such as data, survey, title, label, scale, key, category, symbol, interval, more than, fewer than, total, and difference.

Progression across the worksheets
Practice begins with data collection and tally graphs, where each mark represents one response. Children then read and create scaled pictographs and scaled bar graphs, noticing that one picture or one step on an axis may represent more than one item. Labelling graph activities focus on missing titles, axes, keys, and category names. Later pages include line plots draw tasks, data analysis questions, circle graphs for simple parts of a whole, and triple Venn diagrams for sorting items by overlapping properties.
A simple parent routine
At home, ask your child one small question, such as “Which snack did family members choose?” or “How many books are on each shelf?” Let the child make a tally table first, then choose a graph. Before answering questions, use a quick checklist: What is the title? What does each symbol or scale step mean? Which category is greatest? What is the difference between two categories? This routine turns everyday information into maths practice.

Classroom uses for teachers
Teachers can use these printables for whole-class modelling, maths centres, peer discussion, or independent practice after a data handling lesson. Some sheets work well for survey stations, while others support interpretation practice without needing new data collection. The variety helps teachers compare graph types: when a pictograph is easy to read, when a bar graph shows differences clearly, and when a Venn diagram is better for sorting attributes.

Common errors to watch for
Children may count pictures one by one even when the key says each picture stands for 2, 5, or another value. They may skip axis labels, draw bars with uneven widths, forget a title, place a point between the wrong intervals on a line plot, or put an item in only one circle of a Venn diagram when it belongs in an overlap. Encourage them to circle the scale or key before calculating.
Free printable PDF download
Use this Class 3 data graphing worksheet page to preview the activity, print it, or download it as a PDF for quick practice. It works well for homework, homeschool lessons, tutoring, morning work, revision, and classroom centers.
Answers and answer key support
After the child completes the worksheet independently, parents and teachers can use the answer support or answer key information to check the work, review mistakes, and choose the next practice step.
Why iBloom worksheets help
iBloom worksheets give Class 3 learners repeated practice with different representations rather than one graph type only. The questions ask children to draw, label, compare, total, and explain, so they build both accuracy and reasoning. A child-friendly strategy is: read the title, check the key, trace the category, count by the scale, then answer in a full maths sentence.
Helpful answers
Frequently asked questions
What graph types are included in these Class 3 worksheets?
They include tally graphs, scaled pictographs, scaled bar graphs, line plots, simple line graphs, circle graphs, labelling graph tasks, data collection activities, data analysis questions, and triple Venn diagrams.
How are scaled pictographs different from regular pictographs?
In a scaled pictograph, one picture can stand for more than one item. Children must read the key carefully, then count by that value instead of counting each picture as one.
Are these worksheets suitable for data handling practice in Indian Class 3 maths?
Yes. The worksheets focus on age-appropriate data handling skills for Class 3, including collecting information, organising it, drawing graphs, reading scales, and answering comparison questions.
How can I help my child avoid mistakes in bar graph questions?
Ask your child to read the title, check the scale, look at the correct category label, and trace the bar to the axis. Many mistakes happen when children ignore the scale or compare the wrong bars.
Why are Venn diagrams included with graphing practice?
Venn diagrams help children organise data by properties. Triple Venn diagrams also show overlaps, so children learn that one item can belong to more than one group.
Is this Class 3 data graphing worksheet free?
Yes. You can preview it for free and use the printable worksheet for home or classroom practice.
Can I download this Class 3 data graphing worksheet as a PDF?
Yes. Use the worksheet download option to save a printable PDF, or print the worksheet directly from the page.
Does this Class 3 data graphing worksheet include answers or an answer key?
When the activity has fixed answers, iBloom includes answer support so parents and teachers can check the completed worksheet.