Free printable practice
Circle Graphs Practice Activities
Class 3 maths worksheets for reading circle graphs, comparing sections, using labels and legends, and answering simple data questions.
Practice that builds confidence
What a circle graph shows
These Class 3 circle graphs worksheets help children read data shown as parts of a whole. They practise noticing the title, labels, legend and differently sized sections before answering questions about choices, favourites, quantities and comparisons.
The printable activities include simple circle graph interpretation, count-and-compare questions, drawing conclusions from a graph, and choosing the correct statement. The focus is on understanding what each sector means, not on advanced percentage calculations.
A circle graph, often called a pie chart, shows how one complete group is split into parts. In Class 3, children learn to connect the full circle with the total data set and each section with one category, such as favourite fruits, games, colours or transport choices. Key vocabulary includes title, label, section, sector, legend, total, most, least and equal parts.

How the practice progresses
The worksheets begin with clear graphs where children identify the title and match sections to labels. They then answer questions such as “Which choice has the largest part?” or “How many children chose mango if the label says 8?” Later tasks ask children to compare two sections, find the difference when numbers are given, and decide whether a statement is true from the graph.
A simple parent routine
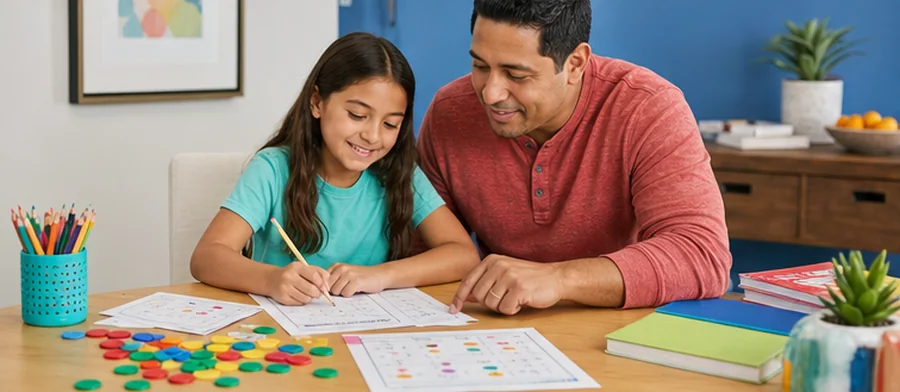
At home, draw a large circle on paper and divide it into a few parts for a familiar topic, such as family snack choices. Ask your child to say what the whole circle represents, point to the biggest section, point to the smallest section, and make one sentence using “more than” or “less than”. Then let them complete one printable page and explain two answers aloud.
Classroom uses for teachers
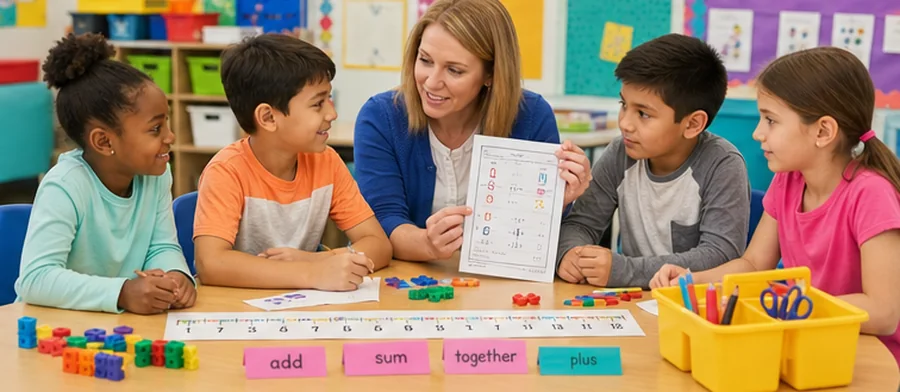
Teachers can use these pages after lessons on tally charts, pictographs and bar graphs to show another way of representing data. The worksheets work well for maths centres, partner discussion, quick checks, or small-group support. They also help children practise reading carefully before calculating.
Common errors to watch for
Children may ignore the title, guess from colour alone, or assume that two similar sections are equal without checking labels. Some mix up “most” and “least”, while others compare only the position of a sector instead of its size. A child-friendly strategy is: read the title, check the key, touch each section, then answer.
Free printable PDF download
Use this class 3 circle graphs worksheet page to preview the activity, print it, or download it as a PDF for quick practice. It works well for homework, homeschool lessons, tutoring, morning work, revision, and classroom centers.
Answers and answer key support
After the child completes the worksheet independently, parents and teachers can use the answer support or answer key information to check the work, review mistakes, and choose the next practice step.
Why iBloom worksheets help
iBloom circle graph activities keep the visual information uncluttered and the questions purposeful. Each page encourages children to observe, compare and explain, so they build confidence with data handling rather than simply filling blanks.
Helpful answers
Frequently asked questions
What will my Class 3 child learn from circle graph worksheets?
Your child will learn to read a circle graph as one whole group divided into parts, identify labels and legends, compare sector sizes, and answer questions about most, least and differences when values are shown.
Are these worksheets about percentages?
No. These Class 3 activities focus on interpreting simple circle graphs visually and through given numbers or labels. They do not require advanced percentage calculations.
How are circle graphs different from bar graphs for this age?
A bar graph compares data using separate bars, while a circle graph shows how categories make up one whole. These worksheets help children see the part-whole relationship clearly.
What should children check first in a circle graph?
They should first read the title to know what the data is about. Then they should check labels or the legend before comparing the sections.
Can these pages be used after pictograph practice?
Yes. After children can read pictographs and bar graphs, circle graph worksheets are a useful next step because they introduce another visual way to organise and compare data.
Is this class 3 circle graphs worksheet free?
Yes. You can preview it for free and use the printable worksheet for home or classroom practice.
Can I download this class 3 circle graphs worksheet as a PDF?
Yes. Use the worksheet download option to save a printable PDF, or print the worksheet directly from the page.
Does this class 3 circle graphs worksheet include answers or an answer key?
When the activity has fixed answers, iBloom includes answer support so parents and teachers can check the completed worksheet.