Free printable practice
Tally Graph Practice Activities
Class 3 maths worksheets for reading, completing, and interpreting tally graphs using groups of five and simple data questions.
Free printable worksheet PDFs
Preview every available page, then download the free worksheet PDF for home, homeschool, tutoring, or classroom practice.
Preview the exact activity before downloading it.
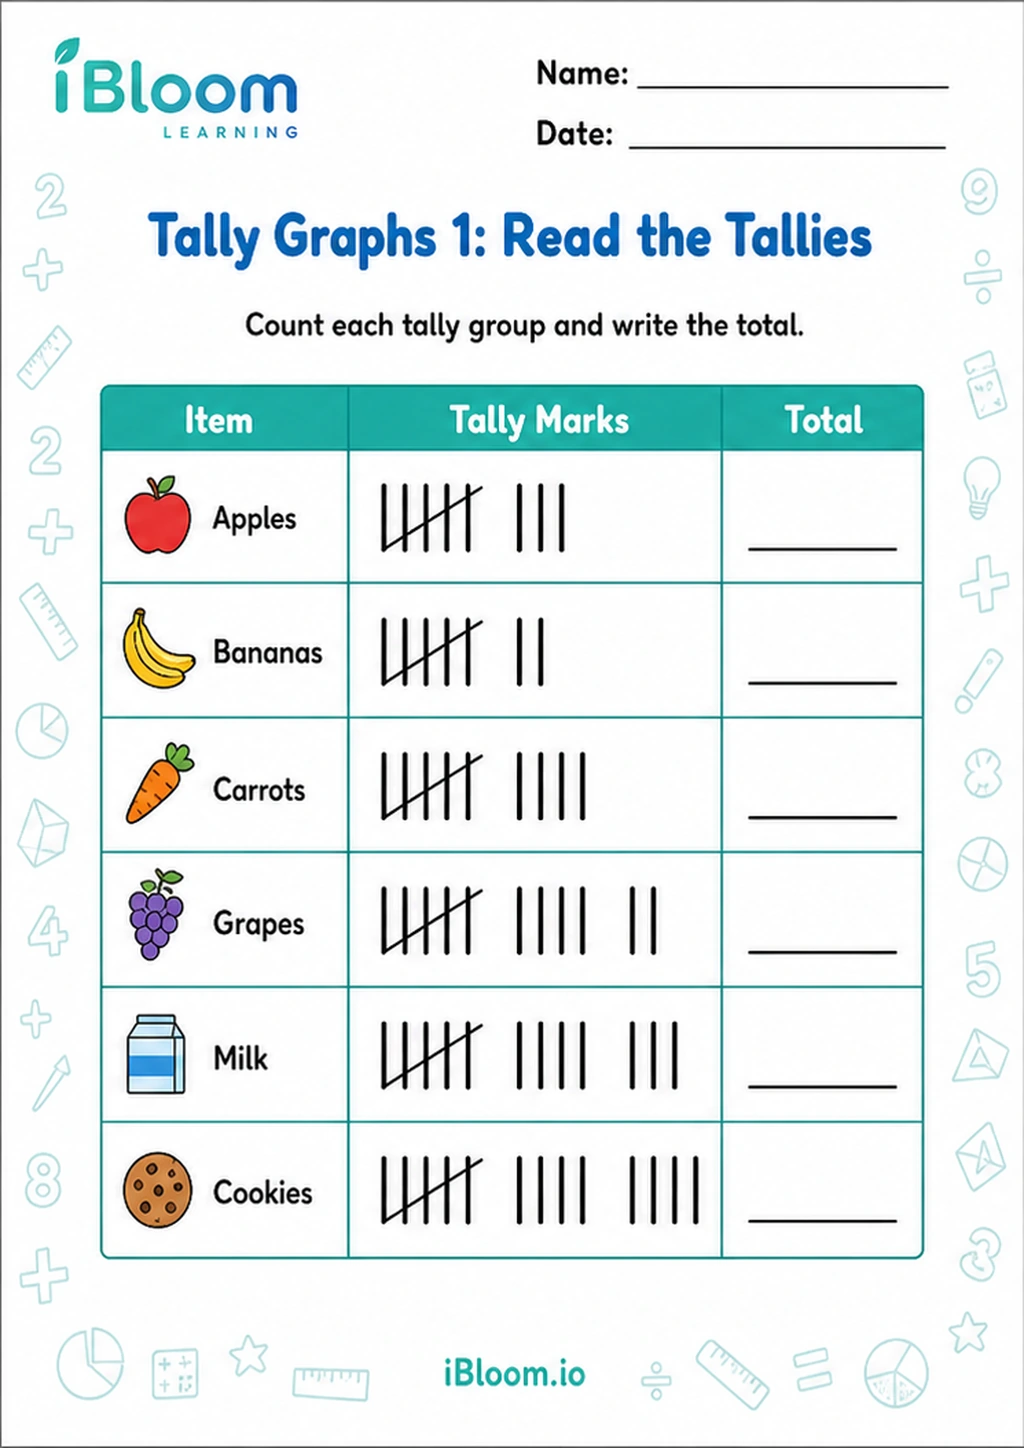 Tally Graphs 1: Read the TalliesClass 3 printable practice for Tally Charts and Graphs.Class 3Free PDF preview
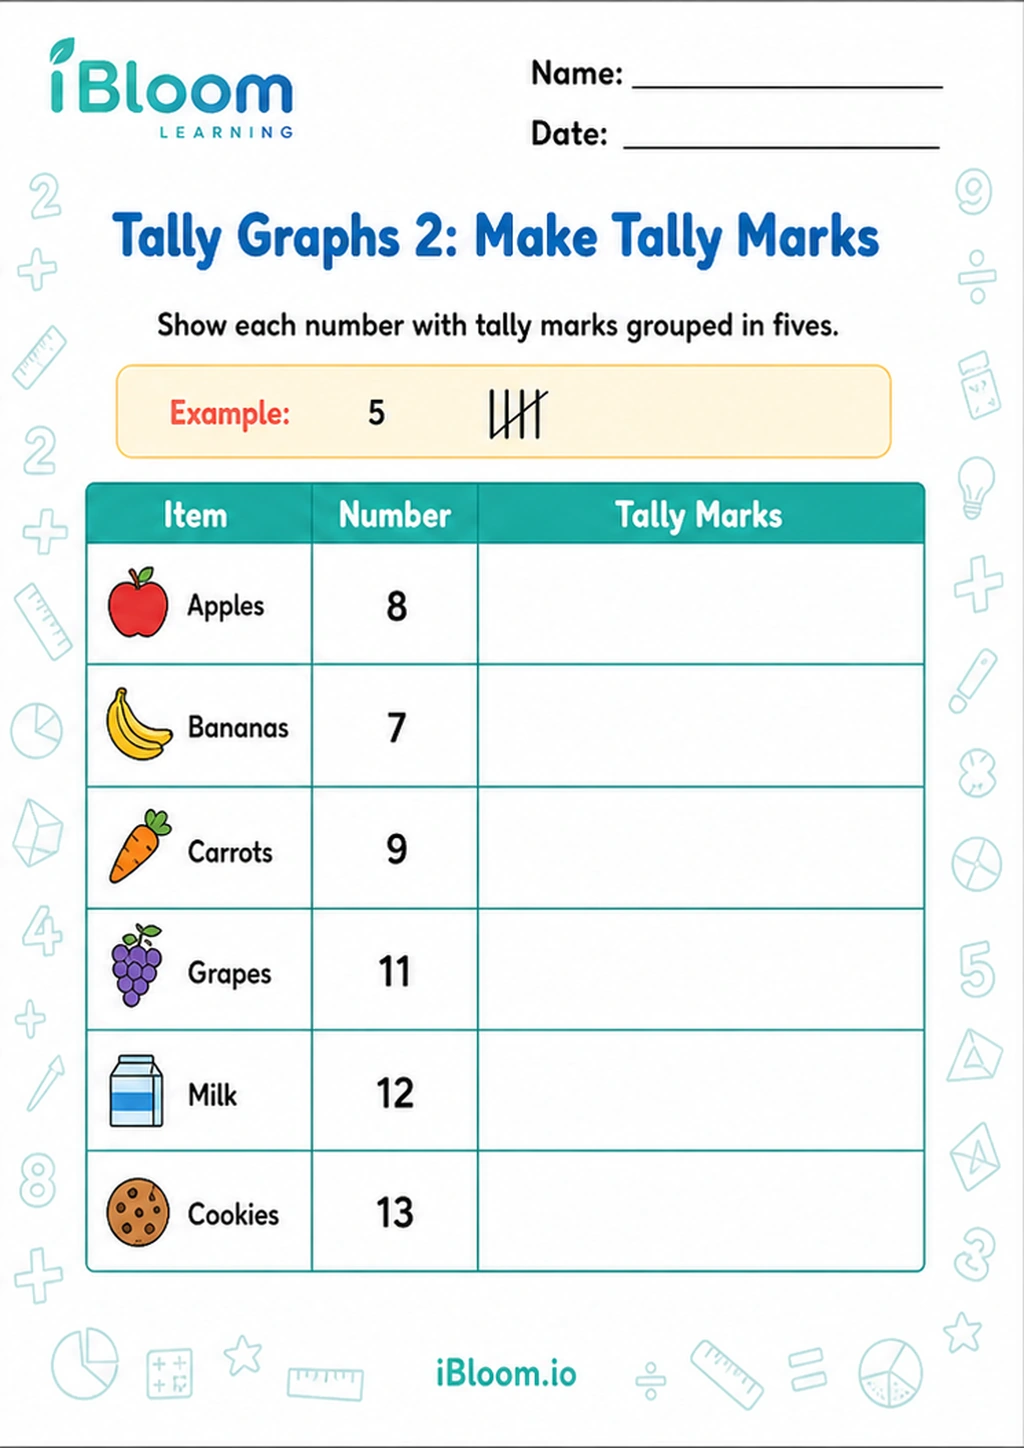 Tally Graphs 2: Make Tally MarksClass 3 printable practice for Tally Charts and Graphs.Class 3Free PDF preview
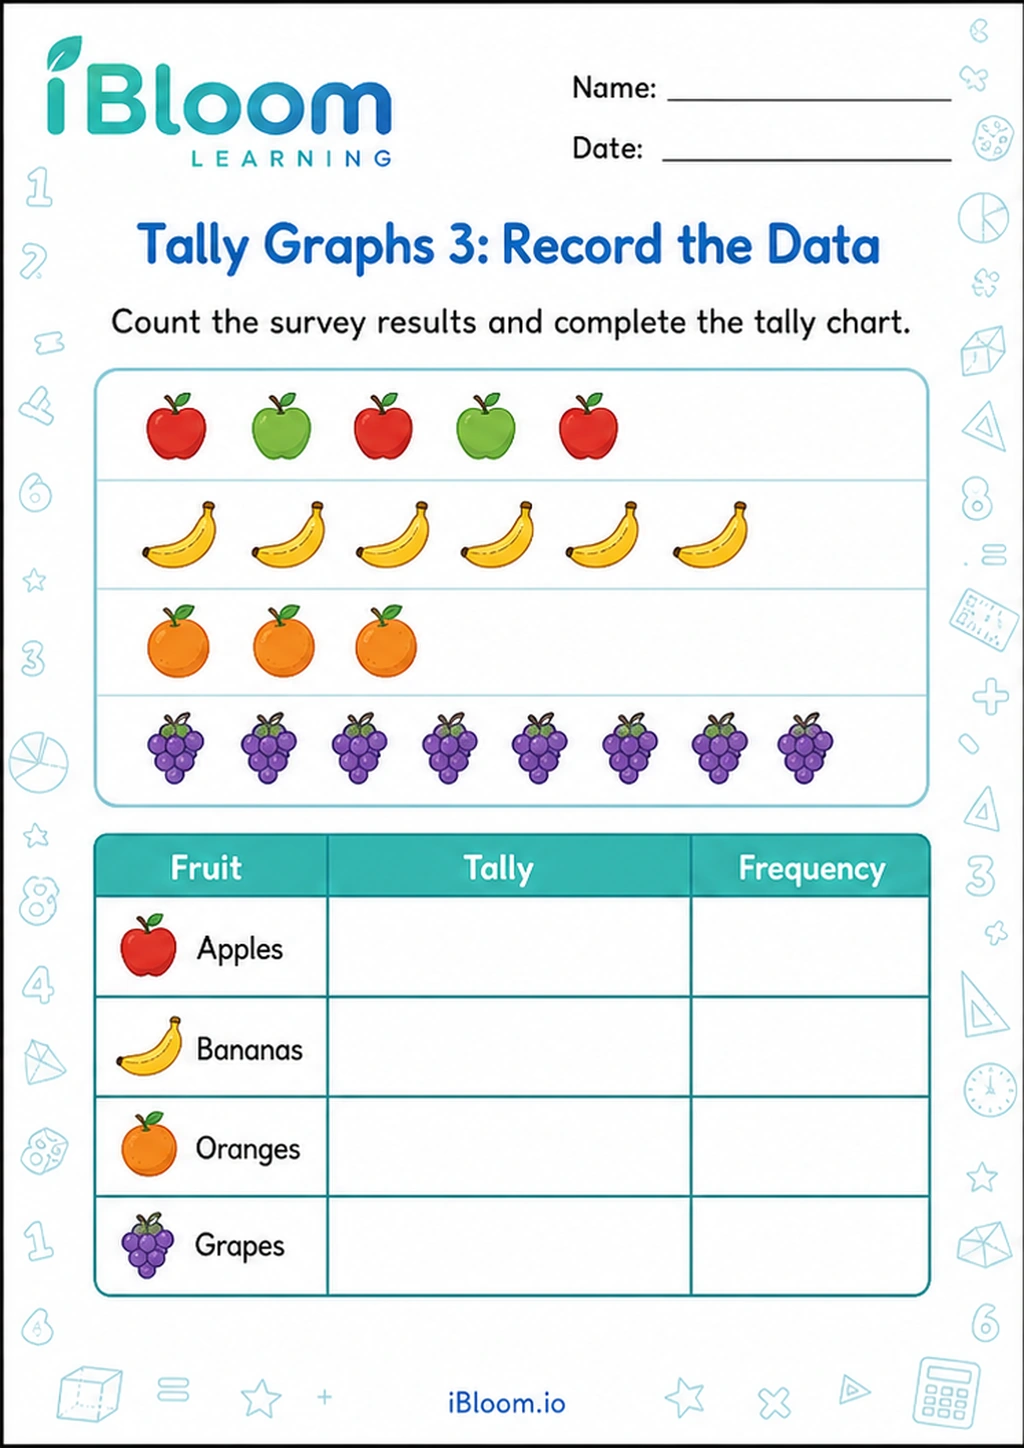 Tally Graphs 3: Record the DataClass 3 printable practice for Tally Charts and Graphs.Class 3Free PDF preview
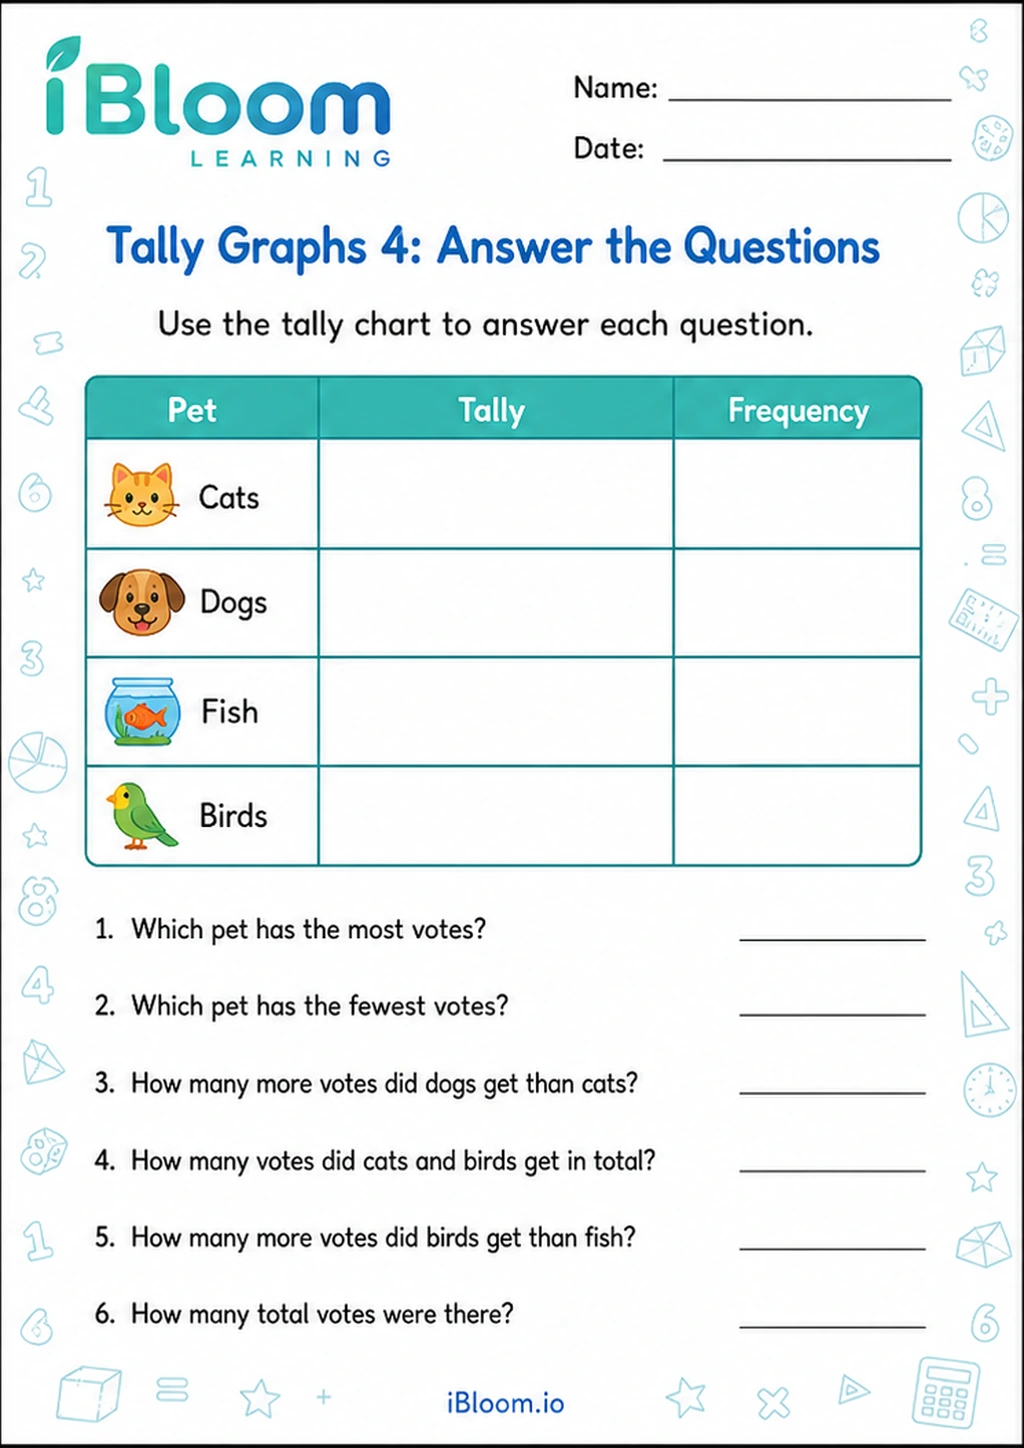 Tally Graphs 4: Answer the QuestionsClass 3 printable practice for Tally Charts and Graphs.Class 3Free PDF preview
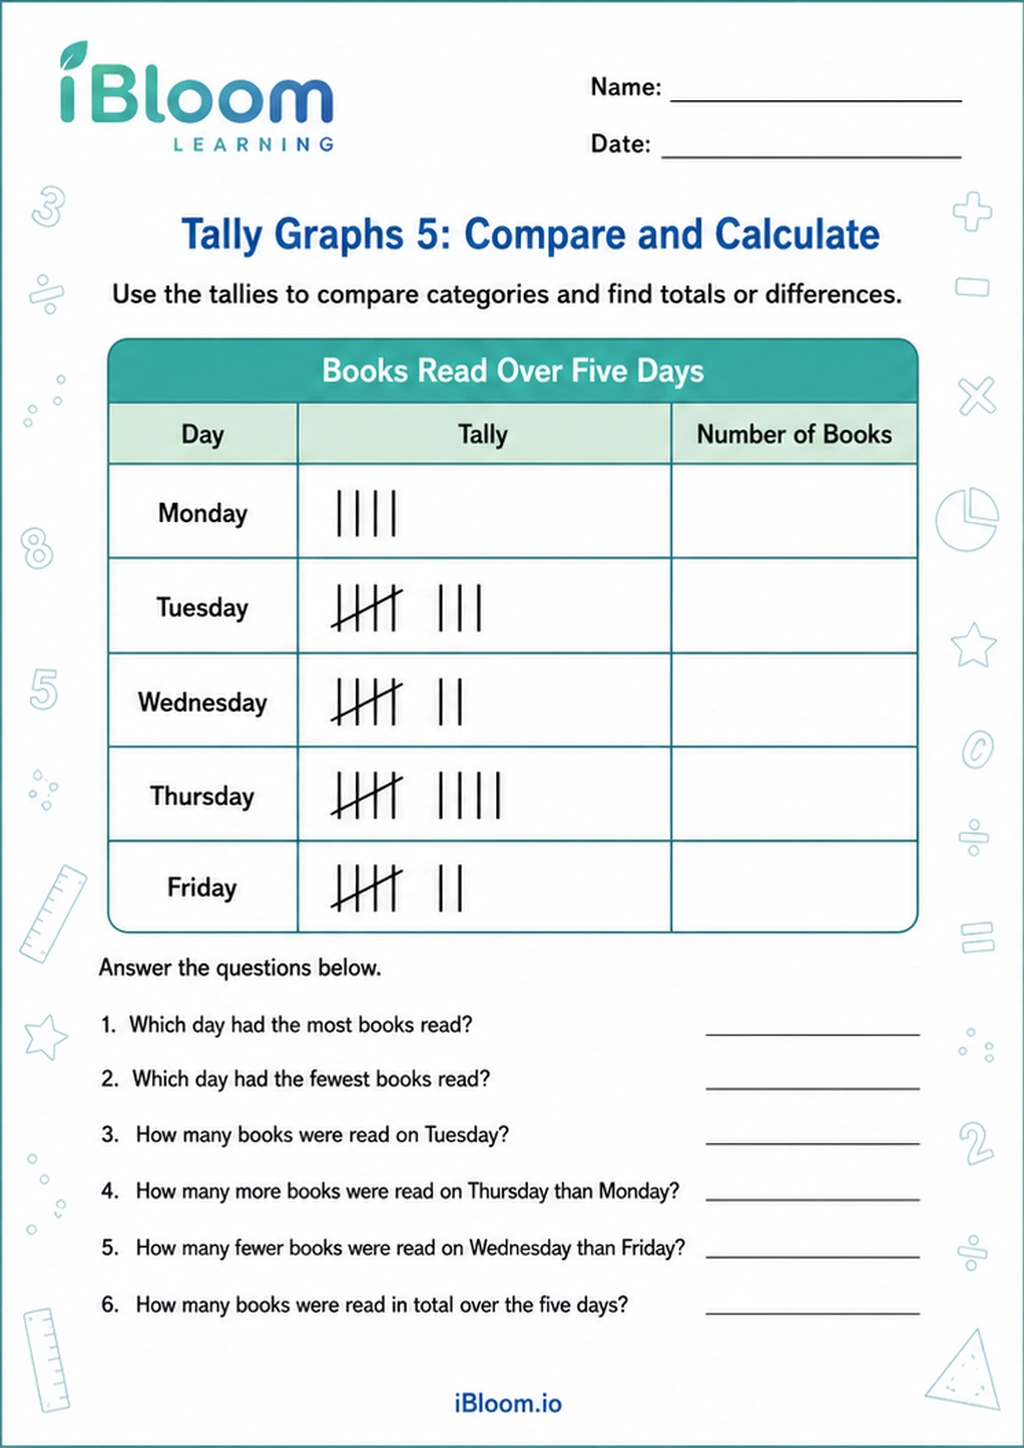 Tally Graphs 5: Compare and CalculateClass 3 printable practice for Tally Charts and Graphs.Class 3Free PDF preview
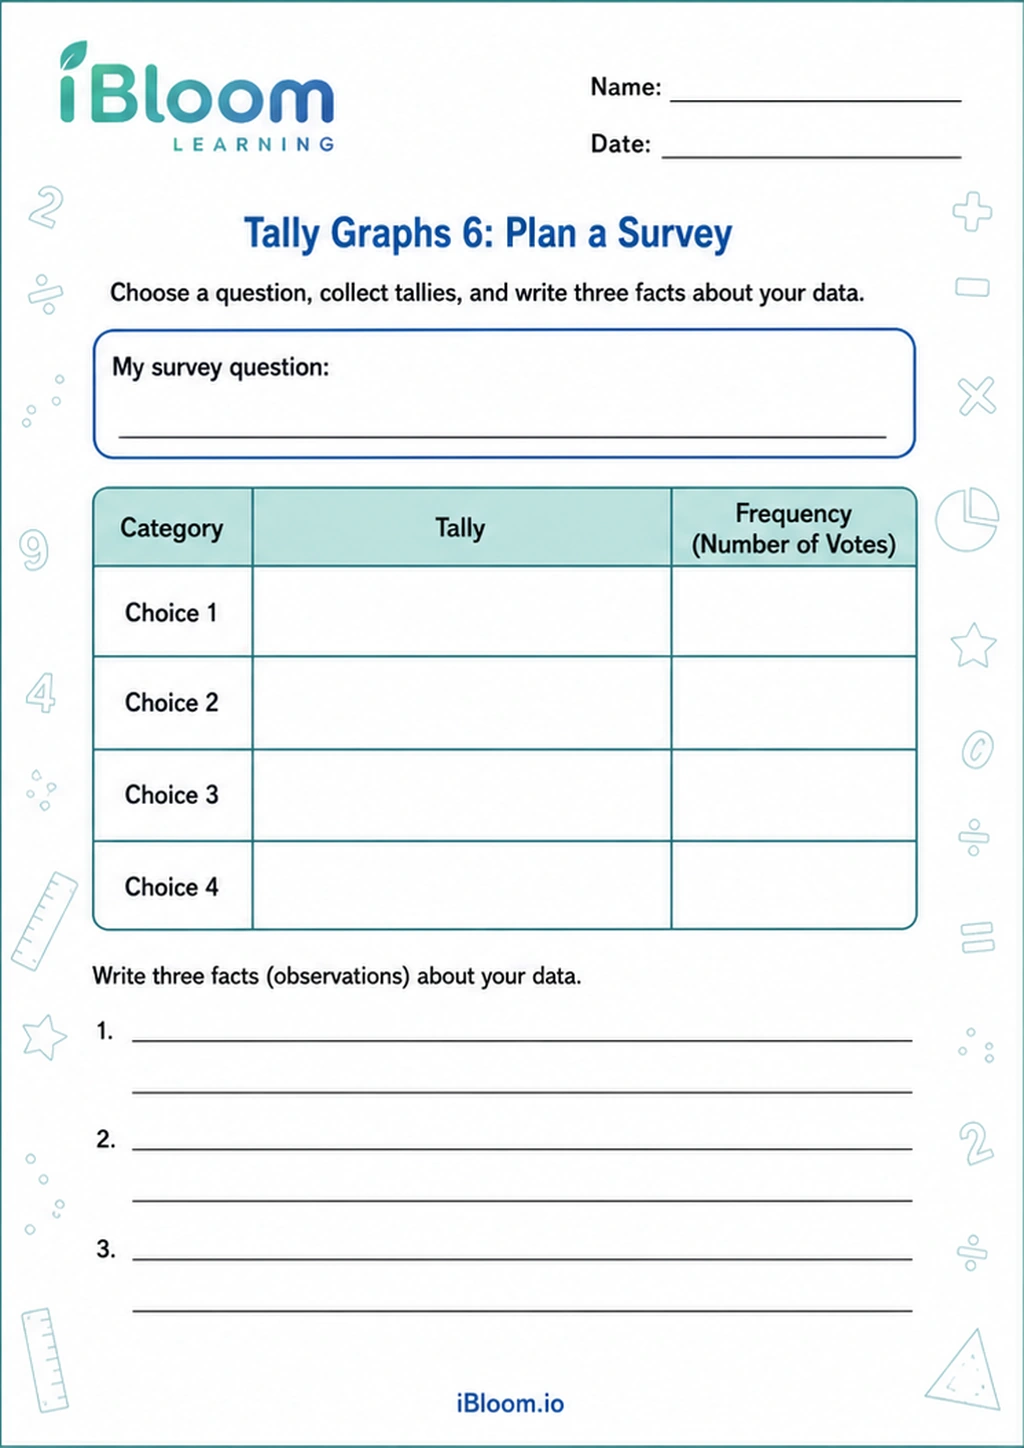 Tally Graphs 6: Plan a SurveyClass 3 printable practice for Tally Charts and Graphs.Class 3Free PDF preview
Practice that builds confidence
Understanding tally graphs
These Class 3 tally graph practice activities help children organise data using tally marks, count totals accurately, and answer questions from a simple graph. Learners practise seeing four straight marks and a fifth crossing mark as one group of five.
The printable worksheets include activities for counting tallies, completing missing entries, comparing categories, and interpreting real-life data such as favourite fruits, colours, games, or classroom choices. Each task builds confidence in data graphing step by step.
A tally graph shows how many times each category occurs. In Class 3 maths, children move from counting single tally marks to reading grouped tallies, especially 5, 10, 15, and nearby numbers. They learn vocabulary such as category, tally, total, data, most, least, more than, and fewer than.

How the practice progresses
The worksheets begin with reading ready-made tally graphs, then ask children to write totals beside each row. Later questions may ask them to complete missing tally marks from a given number, compare two categories, or answer statements such as “How many more children chose cricket than football?” This keeps the focus on both representation and reasoning.
Parent routine at home
Choose one small survey, such as snacks eaten in a week or vehicles seen from a window. Ask your child to make one tally mark for each item and cross the fifth mark to make a bundle of five. After counting, ask three oral questions: Which has the most? Which has the least? How many in all? Then use a worksheet page to practise the same thinking on paper.

Classroom uses for teachers
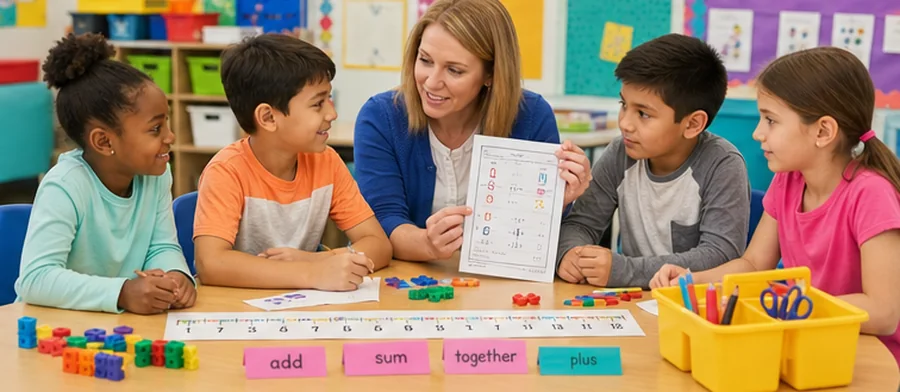
Teachers can use these printables during data graphing lessons, maths centres, pair work, or quick revision. One child can read a tally graph while another checks totals. The sheets also work well after a class survey because children can compare their own collected data with the worksheet examples.
Common errors to watch for
Some children count the crossed fifth mark as an extra mark instead of part of the group of five. Others forget to restart counting after each bundle, skip a category label, or answer “most” questions by looking at row length rather than total. Encourage children to touch each group and say 5, 10, 15 before adding leftover marks.
Free printable PDF download
Use this Class 3 tally graph worksheet page to preview the activity, print it, or download it as a PDF for quick practice. It works well for homework, homeschool lessons, tutoring, morning work, revision, and classroom centers.
Answers and answer key support
After the child completes the worksheet independently, parents and teachers can use the answer support or answer key information to check the work, review mistakes, and choose the next practice step.
Why iBloom worksheets help
The activities are designed around clear rows, familiar Class 3 contexts, and questions that require more than copying totals. A child-friendly strategy is: “Circle each group of five, count by fives, then count the singles.” This simple routine makes tally graphs easier to read and reduces counting mistakes.
Helpful answers
Frequently asked questions
What will my Class 3 child practise in these tally graph worksheets?
Your child will practise reading tally marks, counting groups of five, writing totals, completing tally graphs, and answering simple comparison questions using data.
How should children count tally marks correctly?
They should count each crossed set as 5, then add any single marks left in the row. For example, two crossed groups and three singles make 13.
Are these worksheets only about drawing tally marks?
No. Children also interpret the data by finding the most or least popular category, comparing two categories, and sometimes finding the total number of responses.
What common mistake happens with tally graphs?
A common mistake is counting the diagonal fifth mark as one more after already counting the four straight marks. The full bundle represents exactly five.
How can I connect tally graph practice to daily life?
Ask your child to record real data, such as favourite fruits at home or colours of cars seen outside, using tally marks before answering questions about the results.
Is this Class 3 tally graph worksheet free?
Yes. You can preview it for free and use the printable worksheet for home or classroom practice.
Can I download this Class 3 tally graph worksheet as a PDF?
Yes. Use the worksheet download option to save a printable PDF, or print the worksheet directly from the page.
Does this Class 3 tally graph worksheet include answers or an answer key?
When the activity has fixed answers, iBloom includes answer support so parents and teachers can check the completed worksheet.