Free printable practice
Pictographs Practice Activities
Printable grade 1 pictograph worksheets help children read picture data, count categories, compare amounts, and answer simple graph questions.
Free printable worksheet PDFs
Preview every available page, then download the free worksheet PDF for home, homeschool, tutoring, or classroom practice.
Preview the exact activity before downloading it.
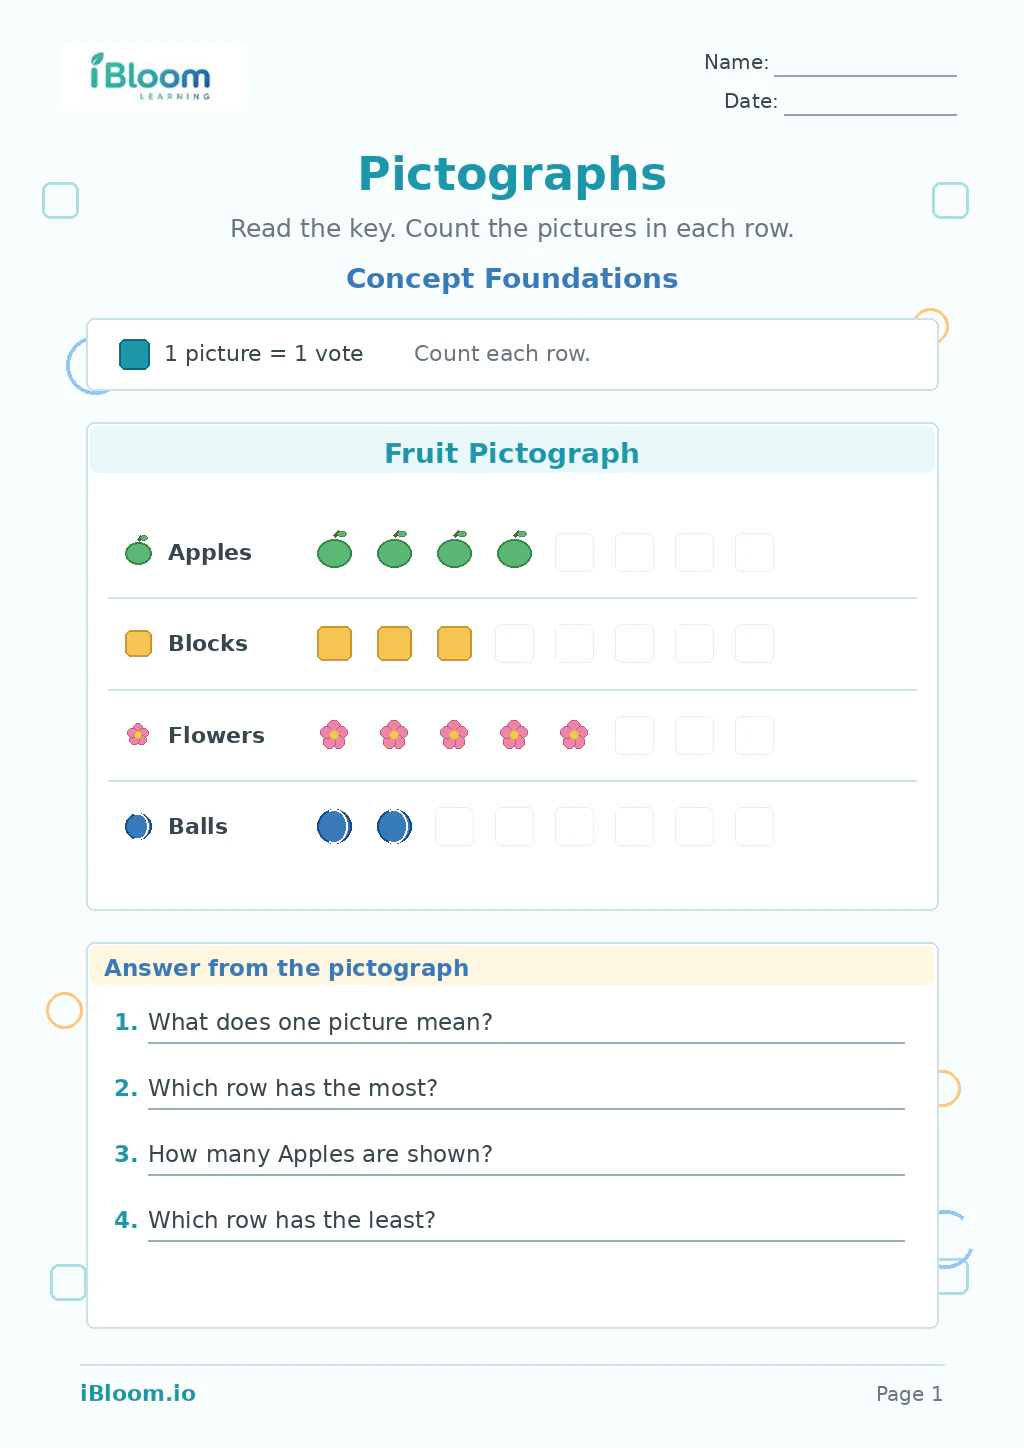 Pictographs — Concept FoundationsPrintable grade 1 pictograph worksheets help children read picture data, count categories, compare amounts, and answer simple graph questions. This Grade 1 foundations worksheet adds concise teaching notes, worked examples, and supported first attempts.Grade 1Free PDF preview
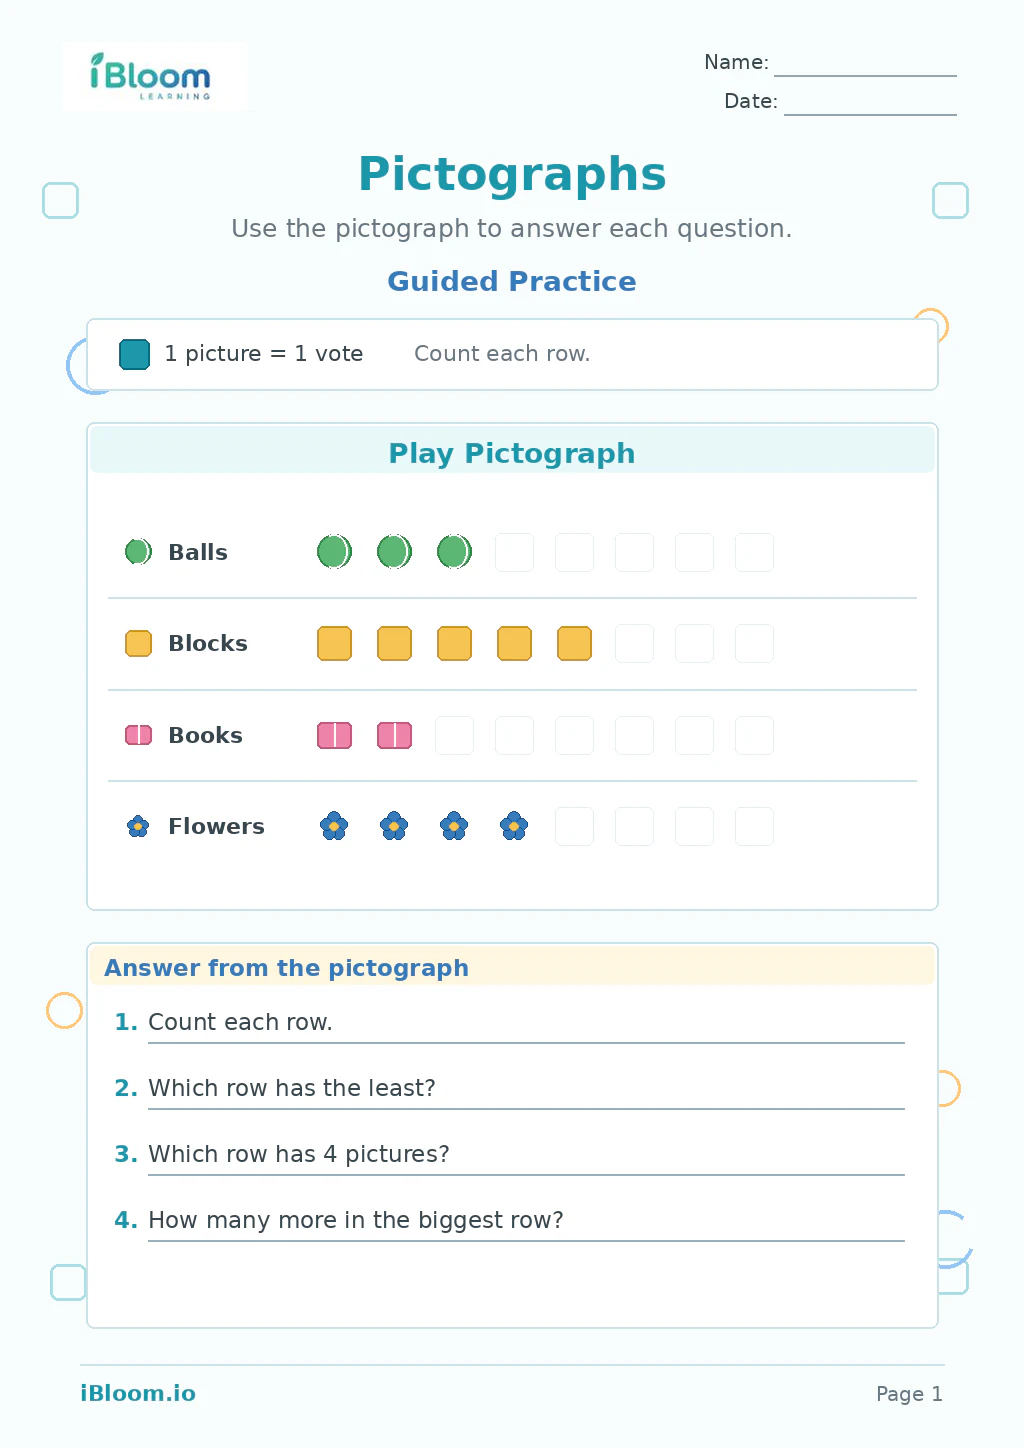 Pictographs — Guided PracticePrintable grade 1 pictograph worksheets help children read picture data, count categories, compare amounts, and answer simple graph questions. This Grade 1 guided-practice worksheet progresses from prompts and checkpoints to independent questions.Grade 1Free PDF preview
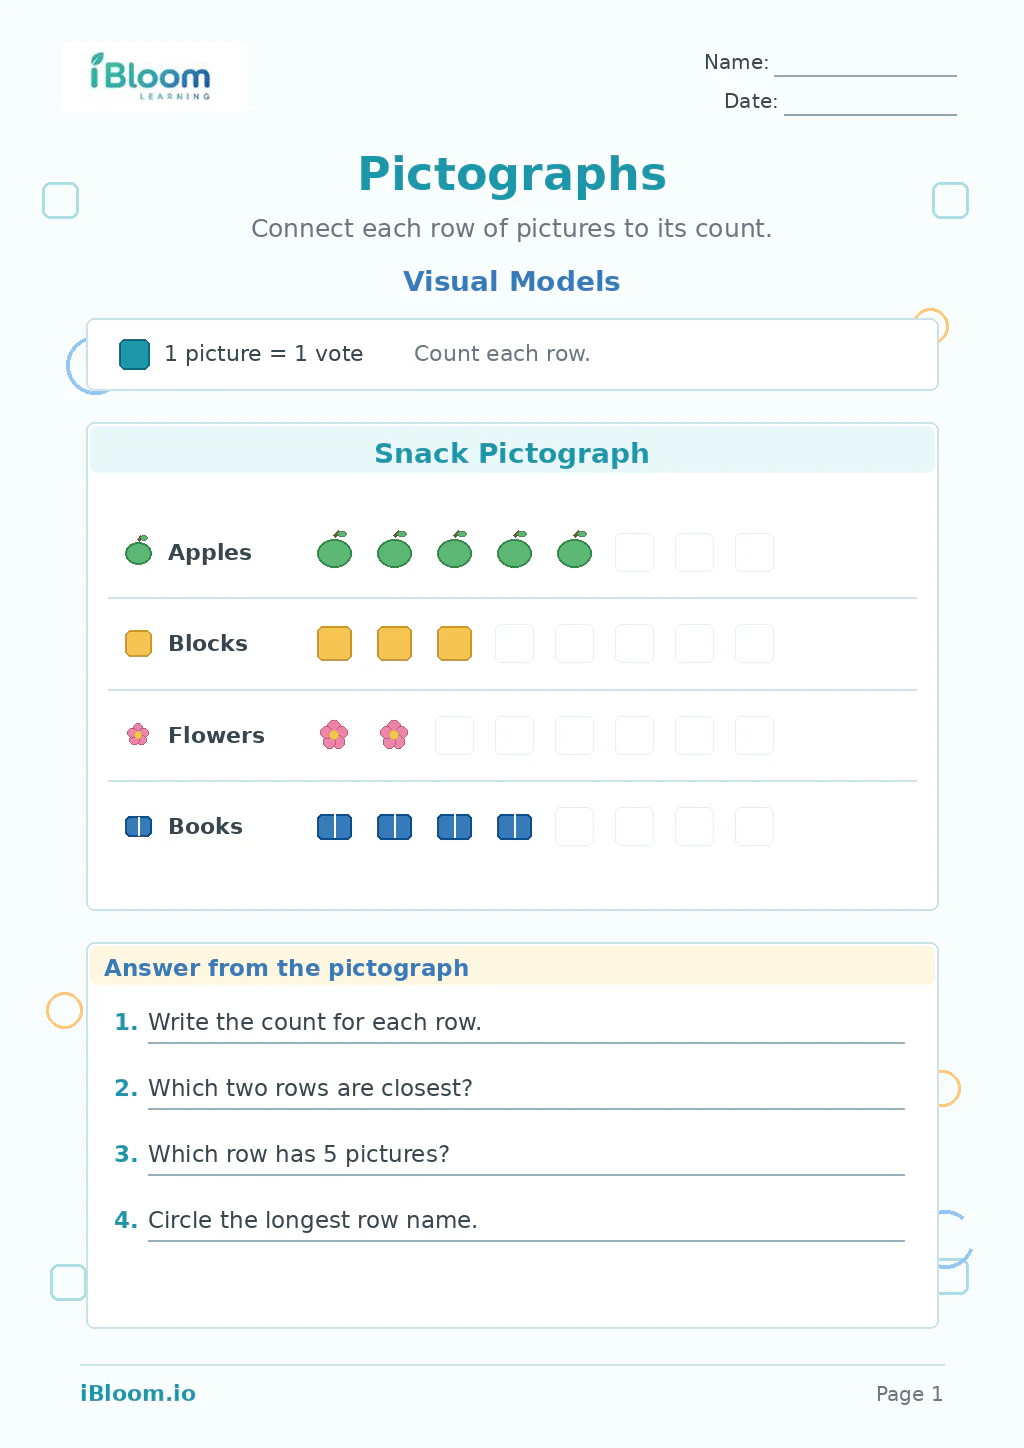 Pictographs — Visual ModelsPrintable grade 1 pictograph worksheets help children read picture data, count categories, compare amounts, and answer simple graph questions. This Grade 1 visual-model worksheet connects suitable diagrams, tables, number lines, or place-value models to mathematical notation.Grade 1Free PDF preview
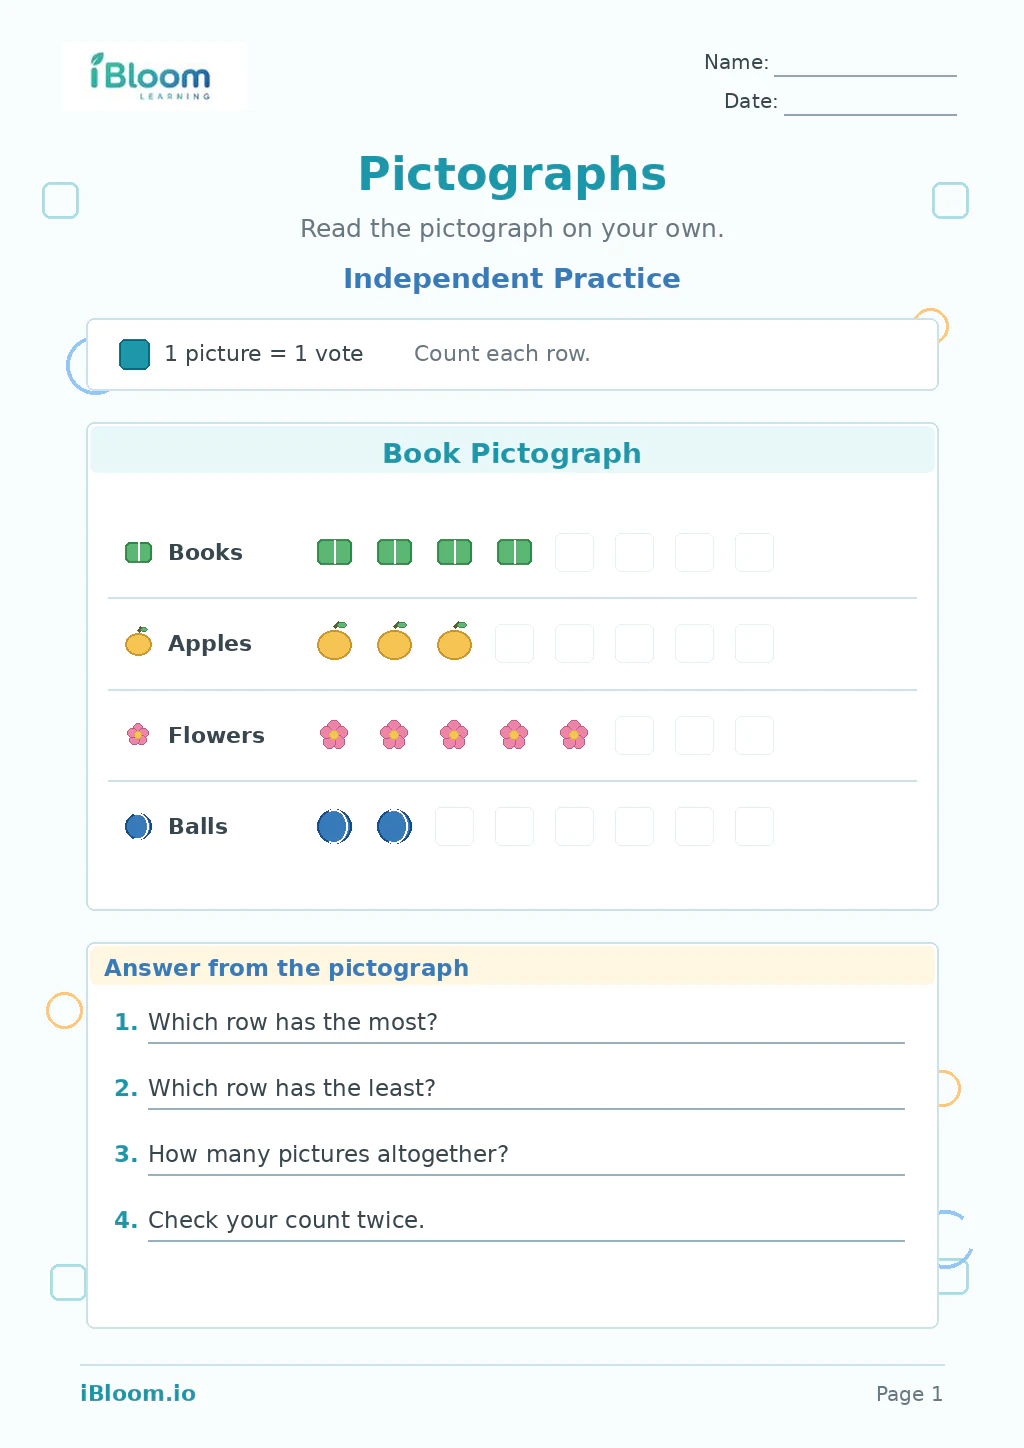 Pictographs — Independent PracticePrintable grade 1 pictograph worksheets help children read picture data, count categories, compare amounts, and answer simple graph questions. This Grade 1 independent-practice worksheet provides a balanced sequence of accurate, grade-level exercises.Grade 1Free PDF preview
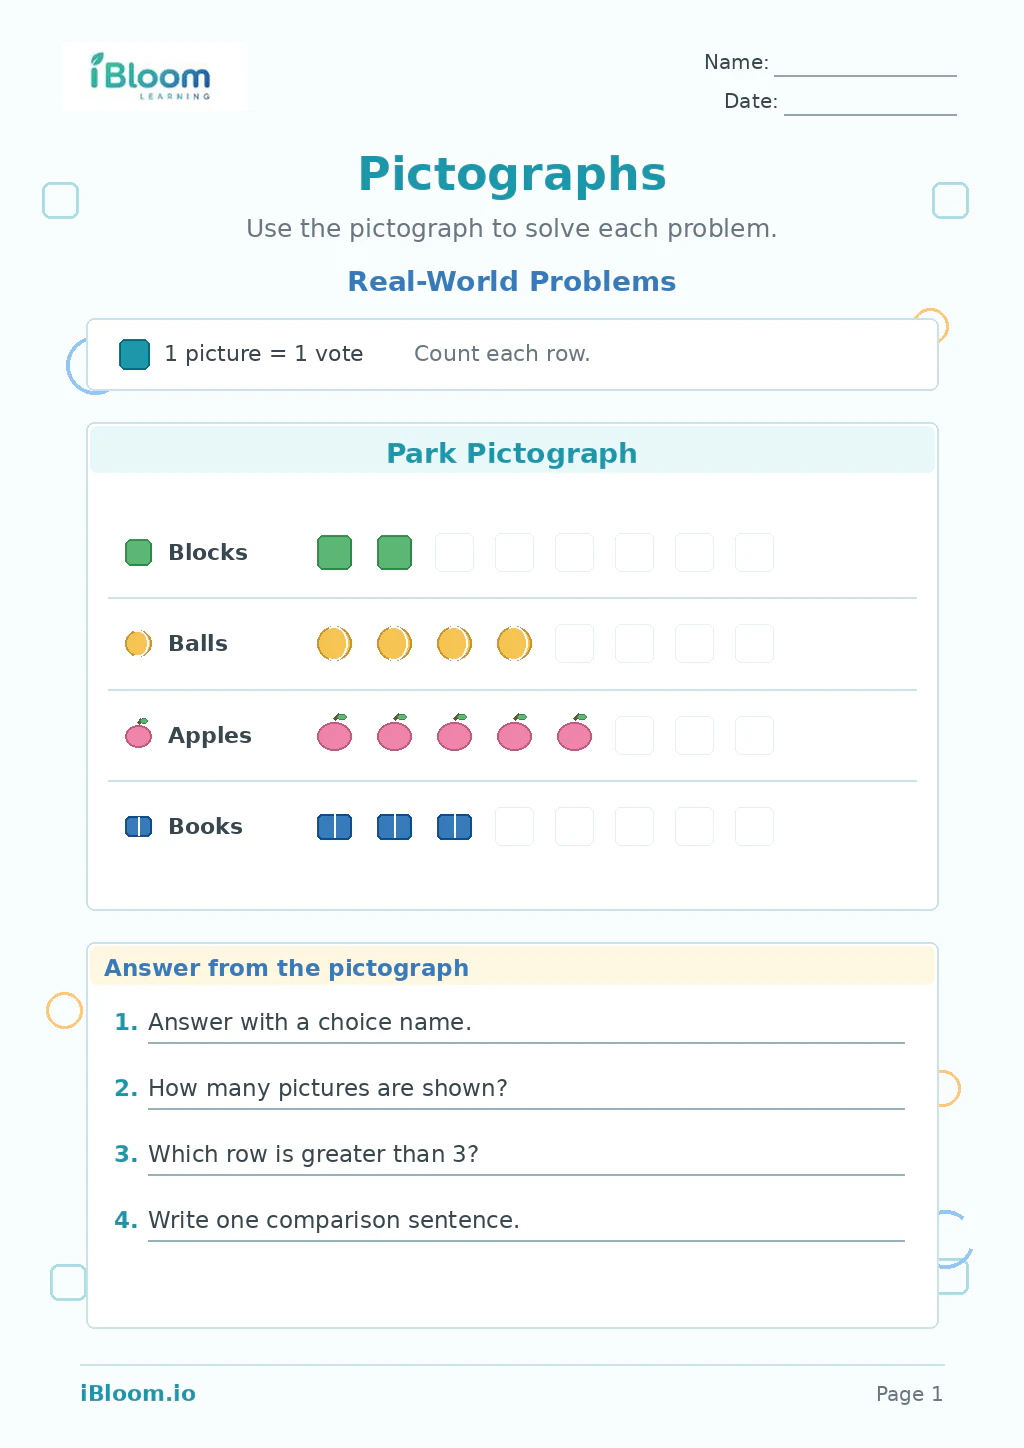 Pictographs — Real-World ProblemsPrintable grade 1 pictograph worksheets help children read picture data, count categories, compare amounts, and answer simple graph questions. This Grade 1 application worksheet uses realistic one-step and multi-step situations with room to model and solve.Grade 1Free PDF preview
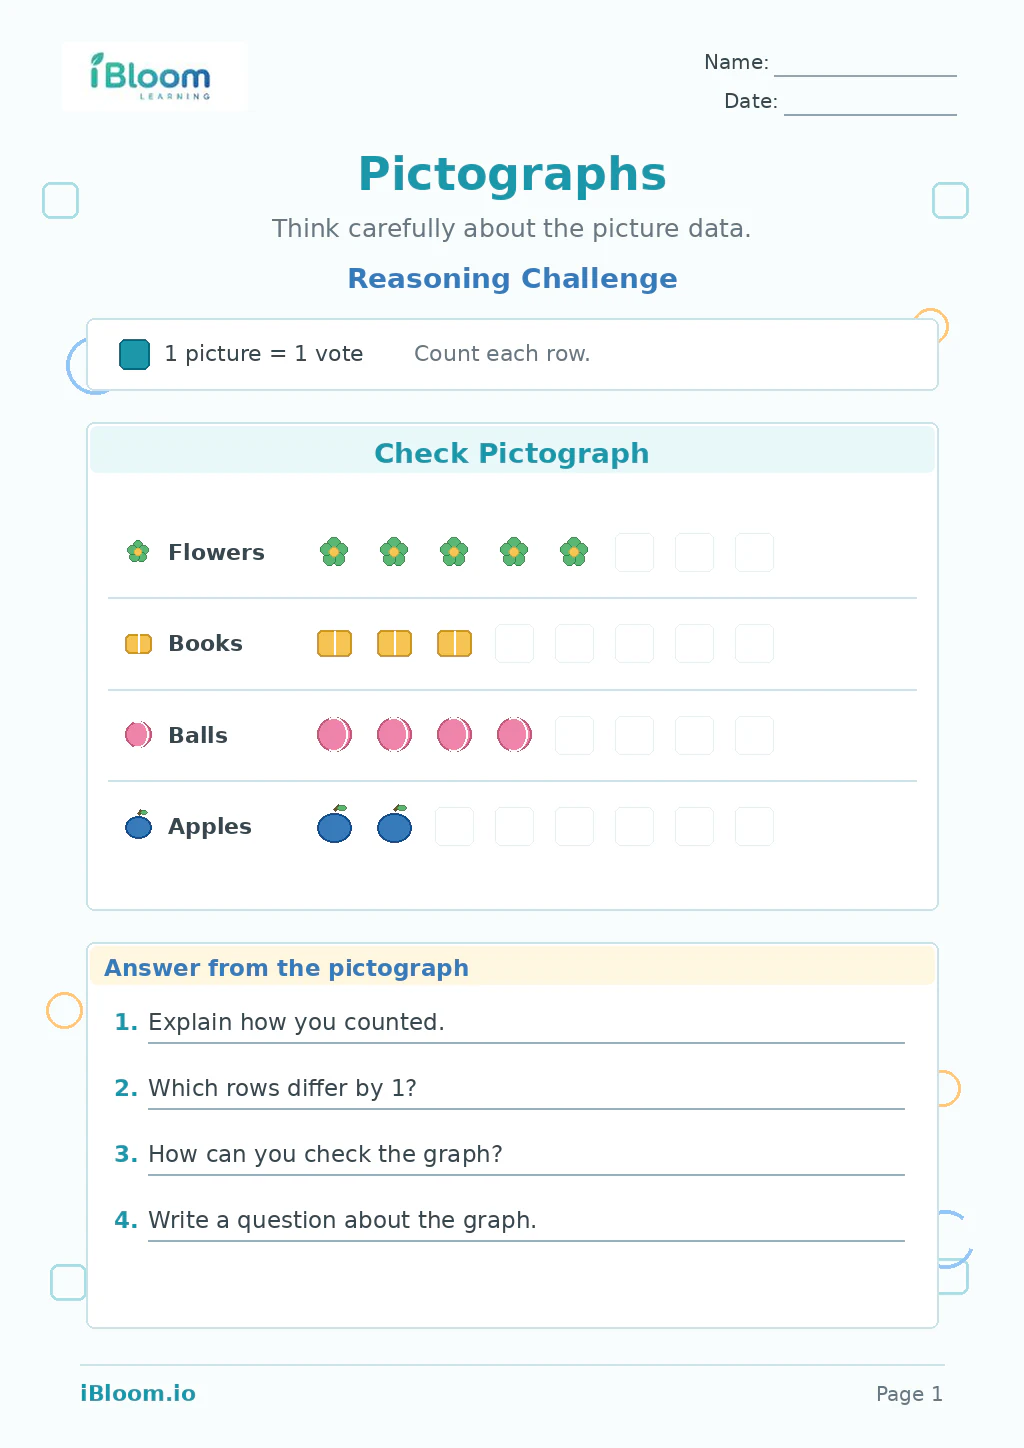 Pictographs — Reasoning ChallengePrintable grade 1 pictograph worksheets help children read picture data, count categories, compare amounts, and answer simple graph questions. This Grade 1 reasoning worksheet combines error analysis, strategy comparison, missing information, and a gentle extension.Grade 1Free PDF preview
Practice that builds confidence
What children learn from pictographs
These grade 1 pictograph practice activities help children read information shown with pictures instead of long lists of numbers. Students count symbols, match them to categories, and answer questions using words such as most, fewest, more, fewer, same, and total.
The printable worksheets include clear picture graphs with familiar themes and simple question prompts. Children practise noticing the title, reading category labels, counting carefully, and using the graph as evidence for each answer.
Pictographs give first graders a visual way to understand data. Instead of starting with tables or abstract charts, children see one picture representing an item or vote, such as one apple, pet, book, or favorite color choice. They learn that every symbol must be counted only once and that the row or column label tells what the pictures mean.
From counting to comparing
The skill progression begins with counting pictures in one category, then answering direct questions such as “How many chose cats?” Next, children compare two categories: “How many more chose dogs than fish?” or “Which has the fewest?” They also combine groups to find a total. This builds early graph reading, addition, subtraction comparison, and precise math language.
A simple parent routine
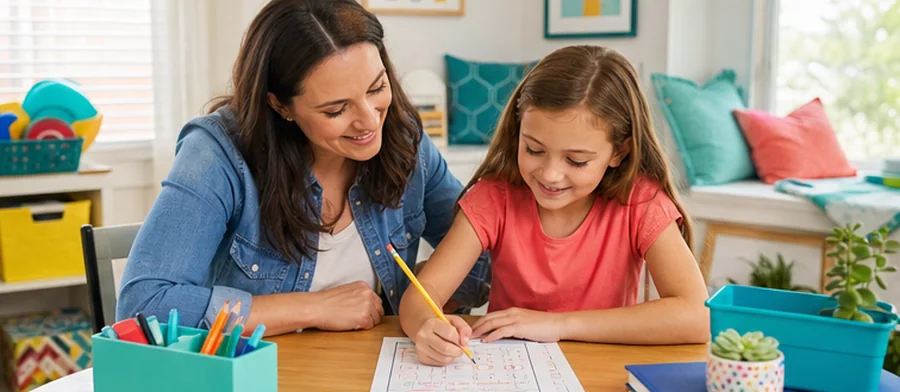
At home, ask your child to point to the graph title first, then trace each category label with a finger. Have them touch and count each picture slowly, writing the number beside the category if space allows. After each answer, ask, “Which part of the graph showed you that?” This keeps the focus on using data, not guessing from the pictures.
Classroom uses for teachers
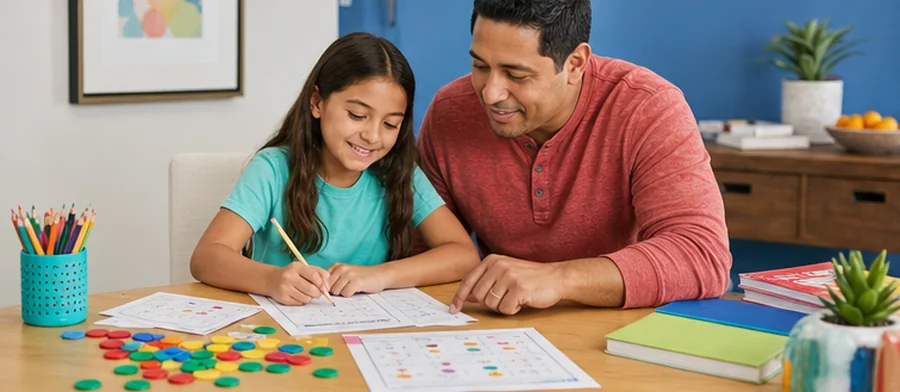
Teachers can use these worksheets during data and graphing lessons, math centers, small-group review, or morning work. They also work well after a class survey: students can compare a real classroom graph with a printed pictograph and discuss how pictures organize information. For partner work, one student can read the question while the other proves the answer on the graph.
Common errors to watch for
Some children count the category label picture as part of the data, skip a symbol, or recount the same symbol twice. Others answer “most” by choosing the row that looks longest without counting. If a key is shown, remind students to check it before counting; many grade 1 graphs use one picture for one item, but children should learn to look for the key.
Free printable PDF download
Use this grade 1 pictograph worksheet page to preview the activity, print it, or download it as a PDF for quick practice. It works well for homework, homeschool lessons, tutoring, morning work, revision, and classroom centers.
Answers and answer key support
After the child completes the worksheet independently, parents and teachers can use the answer support or answer key information to check the work, review mistakes, and choose the next practice step.
Why iBloom worksheets help
The iBloom pictograph worksheets use uncluttered layouts, child-friendly themes, and questions that move from simple counting to comparison and totals. A helpful strategy for children is: “Read the title, find the label, count the pictures, then answer in a sentence.” This routine makes graph work calm, accurate, and understandable.
Helpful answers
Frequently asked questions
What is a pictograph in grade 1 math?
A pictograph is a graph that uses pictures or symbols to show data. In grade 1, children usually count the pictures in each category and compare which group has more, fewer, the most, or the fewest.
Do these worksheets use one picture for one item?
The activities are designed for early graph reading, so they focus on simple pictographs where children can count pictures directly. If a key appears, children should check it before answering.
What vocabulary should my child know for pictographs?
Helpful words include title, category, label, data, picture, symbol, key, most, fewest, more, fewer, same, and total.
How can I help if my child keeps miscounting the pictures?
Have your child touch each picture once while counting aloud. They can also place a small mark under each counted picture or lightly cover pictures with a finger as they move across the row.
How do pictographs support addition and subtraction?
Children add when they find the total across categories and subtract or compare when they answer questions such as how many more one category has than another.
Is this grade 1 pictograph worksheet free?
Yes. You can preview it for free and use the printable worksheet for home or classroom practice.
Can I download this grade 1 pictograph worksheet as a PDF?
Yes. Use the worksheet download option to save a printable PDF, or print the worksheet directly from the page.
Does this grade 1 pictograph worksheet include answers or an answer key?
When the activity has fixed answers, iBloom includes answer support so parents and teachers can check the completed worksheet.